
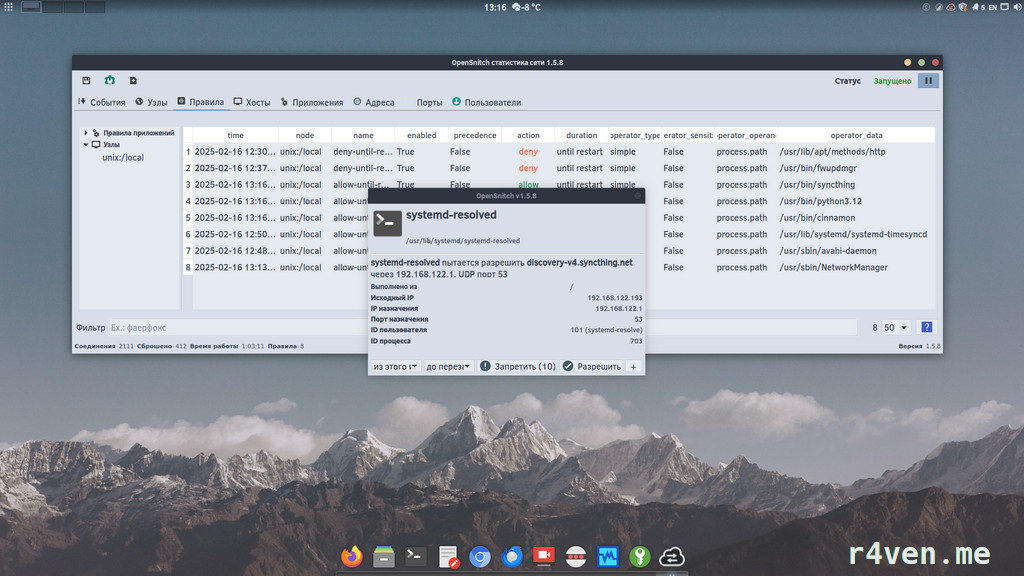
OpenSnitch is a desktop open source application capable of blocking outgoing requests from various programs, with desktop notifications 🔔. In this note we’ll cover installing, launching, and demonstrating how OpenSnitch works on the Linux Mint 22 distribution 🐧.
🖐️Hey!
Subscribe to our Telegram channel @r4ven_me📱, so you don’t miss new posts on the website 😉. If you have questions or just want to chat about the topic, feel free to join the Raven chat at @r4ven_me_chat🧐.
Preface
Some introductory data about the OpenSnitch program 📑:
| Characteristic | Value |
|---|---|
| Platform | Linux |
| Distribution (runtime environment in the article) | Linux Mint 22 |
| OpenSnitch version reviewed | 1.5.8 |
| Written in | Python, Go, C, Qt |
| Software category | Firewalls |
| Network traffic control methods | proc or ebpf or auditd |
| Log file | /var/log/opensnitchd.log |
OpenSnitch is an information security tool that lets you significantly increase the level of control over your system (and we love that 😌). The project is inspired by a similar tool for MacOS: Little Snitch.

The OpenSnitch program works as a service/daemon, managed through a desktop GUI application.
The main concept: when any user program/utility attempts to make a request to a network resource (including the internet), OpenSnitch will block it and display a graphical notification. Depending on the decision made (allow, deny, or take no action), a filtering rule is created, which can later be changed/deleted, and configured flexibly if needed. New rules can also be created manually.
In the first stages of use, OpenSnitch may seem excessive in terms of control, since with every little thing any network activity will be audited with a notification shown and blocked by default 🔒.
But from experience, I’ll say that it’s enough to spend a short period once forming a list of access rules for your applications: allow what’s needed, and sell deny what’s not needed, and OpenSnitch will stop bothering you often 😴.
In return, you’ll be sure that if some proprietary program tries to send data to third-party servers, you’ll know about it. And if you miss the notification, the default policy will be applied — out of the box this is a deny rule.
I developed the habit of using such software back when I was a Windows user 🪟. By the way, there I used a similar open source tool called Simplewall (because even Notepad tries to get on the internet for some reason in Windows 😡). Simplewall’s operating principle is similar to OpenSnitch: blocking connections with notifications shown 💬.

How does it work?
OpenSnitch offers a choice of one of 3 methods for controlling network connections (specified in settings):
- proc – this method checks network connections through the system files:
/proc/net/tcpand/proc/net/udp, linking them to processes by PID. This method is simple to use and can work on most systems, but/procupdates can be delayed, which reduces accuracy and doesn’t always allow blocking a connection before it’s established. - ebpf (recommended) – often the default method, which uses the eBPF mechanism in the Linux kernel to intercept system calls (SOCKET_CONNECT) before a connection is established. According to the developers, this method provides high performance, accuracy, and minimal system load, but requires a modern kernel (5.x+).
- audit – this method records network events via the Linux audit service —
auditd. It allows detailed auditing of network activity, but can work with a delay and creates extra system load, since it works through an intermediary service.
It’s also worth noting that the OpenSnitch project is actively developed 👌 and in recent versions a lot of interesting things have been added, for example:
- Ad and tracker blocking by domain lists (since version 1.4.0)
- Ability to manage the system firewall: Nftables (since version 1.6.0)
- Integration with event collection and audit systems (SIEM) (since version v1.6.0): Syslog, Grafana+Loki+Promtail, or ElasticSearch+LogStash+Kibana
- Setting up a centralized server to manage other OpenSnitch nodes using the same GUI with TLS-secured connections (since version 1.6.1)
- etc.
Looks promising, but let’s leave these features for future material 😇, and today we’ll only cover the basic functionality.
Installing OpenSnitch
This program is in the standard repositories of Linux Mint / Ubuntu / Debian. So just open a terminal, update the package cache, and run the installation:
sudo apt update && sudo apt install -y opensnitch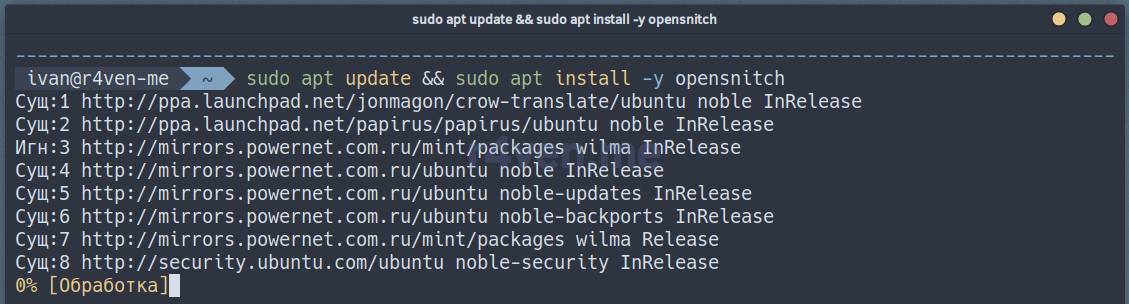
You can check the installed version of OpenSnitch like this:
opensnitchd --version💡 Tip
If you need a newer version, look for it on the releases page. You need to download 2 files: the daemon — opensnitch_<version>_amd64.deb and the GUI — python3-opensnitch-ui_<version>_all.deb.
Two executable files should appear on the system: opensnitchd and opensnitch-ui. The first, as its name suggests, is the service/daemon that runs in the background via the init system systemd. You can check its status with this command:
systemctl status opensnitchThe service should be running, and its autostart should be enabled:
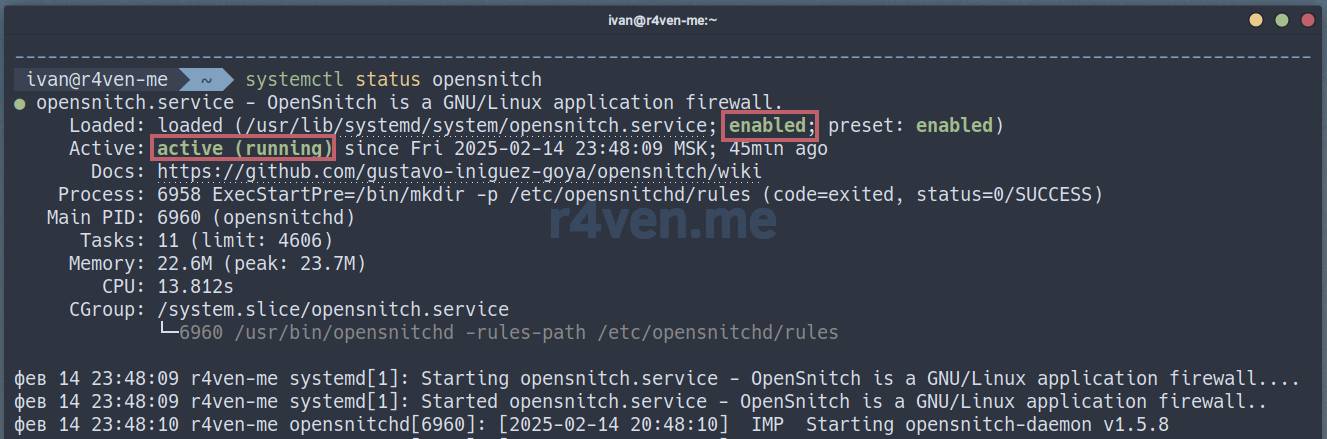
If that’s not the case, run the command:
sudo systemctl enable --now opensnitch📝 Note
Note that privileged sudo rights are required to run the command above.
This command does two things at once: it starts the service and enables its autostart on system boot.
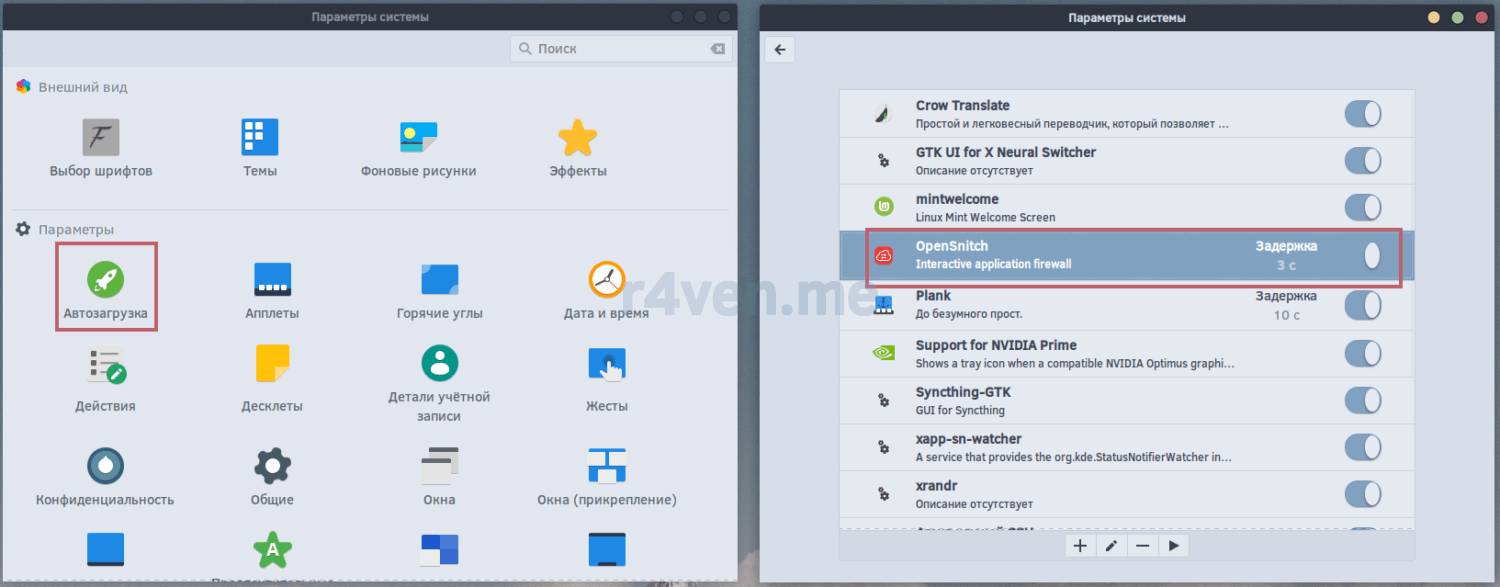
The autostart of the graphical interface (minimized to the tray) is provided via a system .desktop file in the /etc/xdg/autostart directory:
cat /etc/xdg/autostart/opensnitch_ui.desktopYou can disable the GUI autostart (and OpenSnitch itself) in the corresponding section of the system settings:
Launching and overview of the GUI
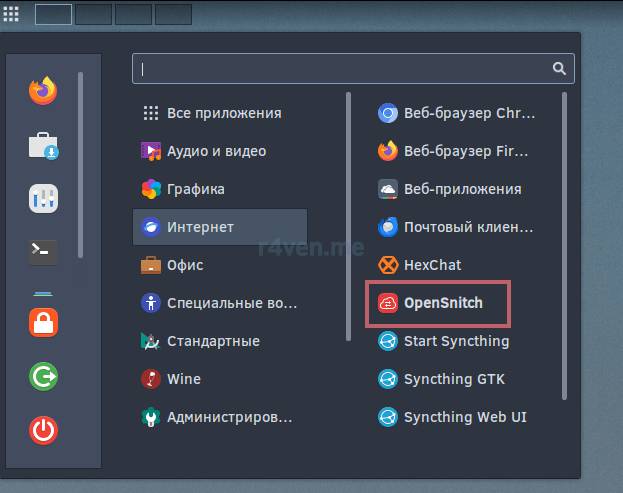
You can perform the first launch of the OpenSnitch graphical interface through the application menu:
The application icon will appear in the system tray. And you’ll most likely see it in action right away: any network activity in the user session will trigger a pop-up notification window:
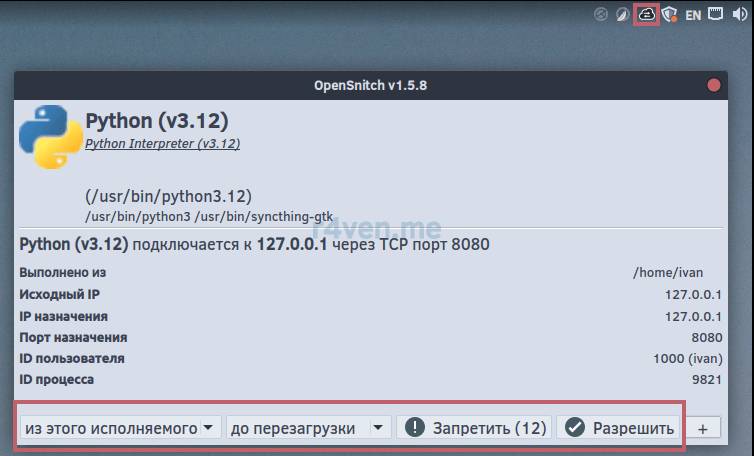
In the example above, the file synchronization program syncthing is trying to connect to TCP port 8080 at address 127.0.0.1.
Here, within 30 seconds, we’re offered the option to create a rule that allows or denies network access to the specified resource.
As you can see in the screenshot above, the following parameters are available for a rule:
| Request type | — by executable file — by specific command — to a specific network address or subnet — to a specific network port — by specific user — by process ID (PID) |
|---|---|
| Rule duration | — until system reboot — once — forever — for a certain period |
| Rule action | — allow the connection — deny the connection |
If no action is chosen before the timer expires, the default policy will be applied. Out of the box this is: deny any network access from the executable file until the next system reboot. This behavior can easily be changed in the program settings, which we’ll discuss below.
⚠️It’s important to understand that network access control will be applied to all programs and utilities (including console ones). So in the early stages I recommend carefully studying exactly what and where is trying to gain access.
For example, in the screenshot below you can see that the name resolution service utility systemd-resolvd is trying to reach a DNS server on the standard port 53:
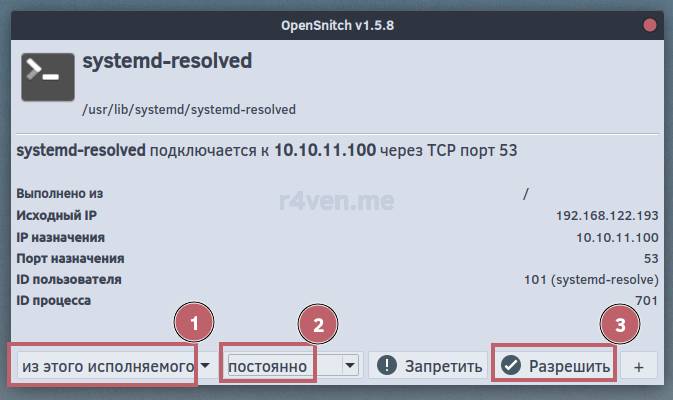
For such system requests it’s best to immediately create persistent rules tied to the executable file, to reduce the number of triggers to nerves in the future.
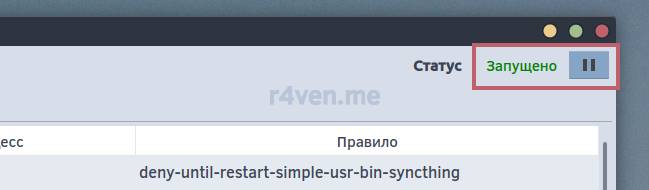
Clicking the OpenSnitch icon in the system tray will open the program’s main window. Note that in the top right corner ↗️ there’s a button to stop OpenSnitch:
The program’s interface is split into tabs 📑, let’s briefly review each of them below.
“Events” tab
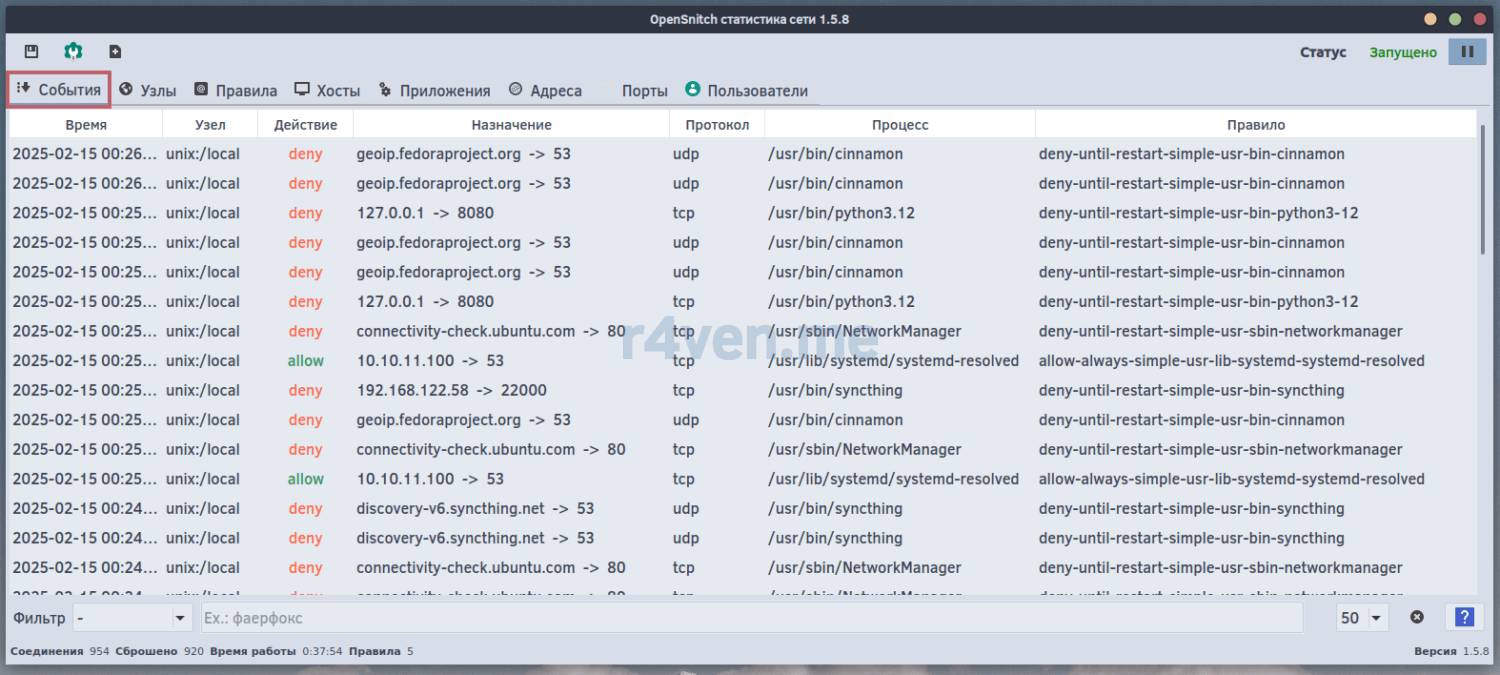
This section is a log of all recorded network connections:
- which process initiated the connection;
- which IP address or domain the connection was established with;
- which protocol and port was used (e.g., TCP/UDP, port 80, 443, etc.);
- the applied rule (allowed/blocked).
It’s convenient here to analyze current connections and identify suspicious activity 🔍.
💡 Tip
A contextual search/filter is available at the bottom of each section.
“Nodes” tab
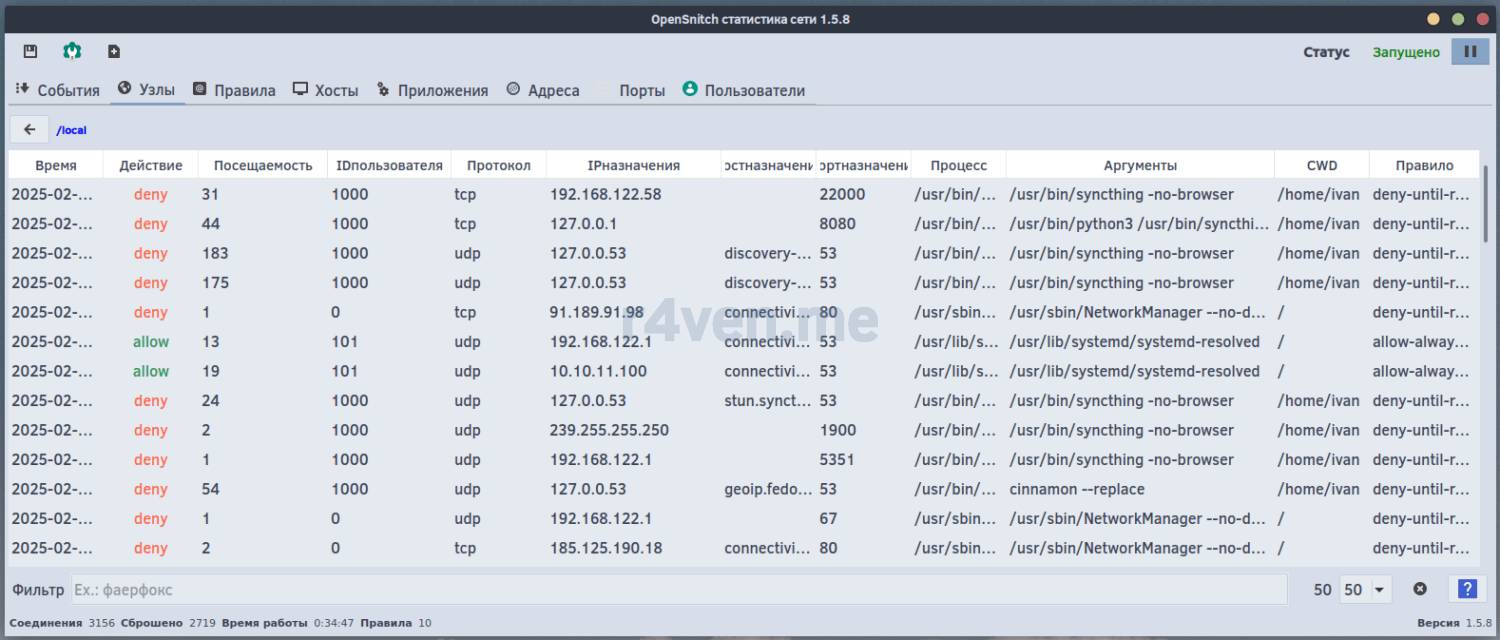
Displays a list of local and remote nodes that OpenSnitch controls:

In our example there’s only our local node here. When using OpenSnitch as a centralized server, the controlled nodes will be displayed here (there will be a separate note about this).
If you “drill into” the selected node with a double click, we’ll see the details of its network activity:
“Rules” tab
The most important section. Here all OpenSnitch traffic filtering rules are listed:
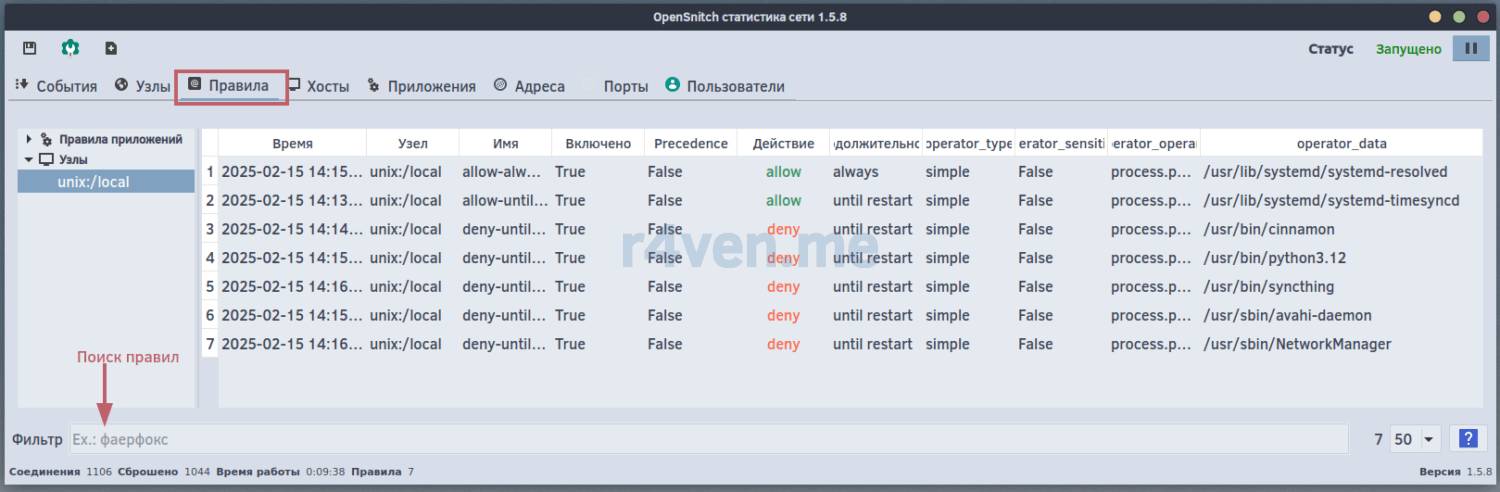
What you can do here:
- create new rules and edit existing ones;
- flexibly configure the parameters I mentioned above;
- search/filter rules by applications, ports, nodes, and users, when there are a lot of rules;
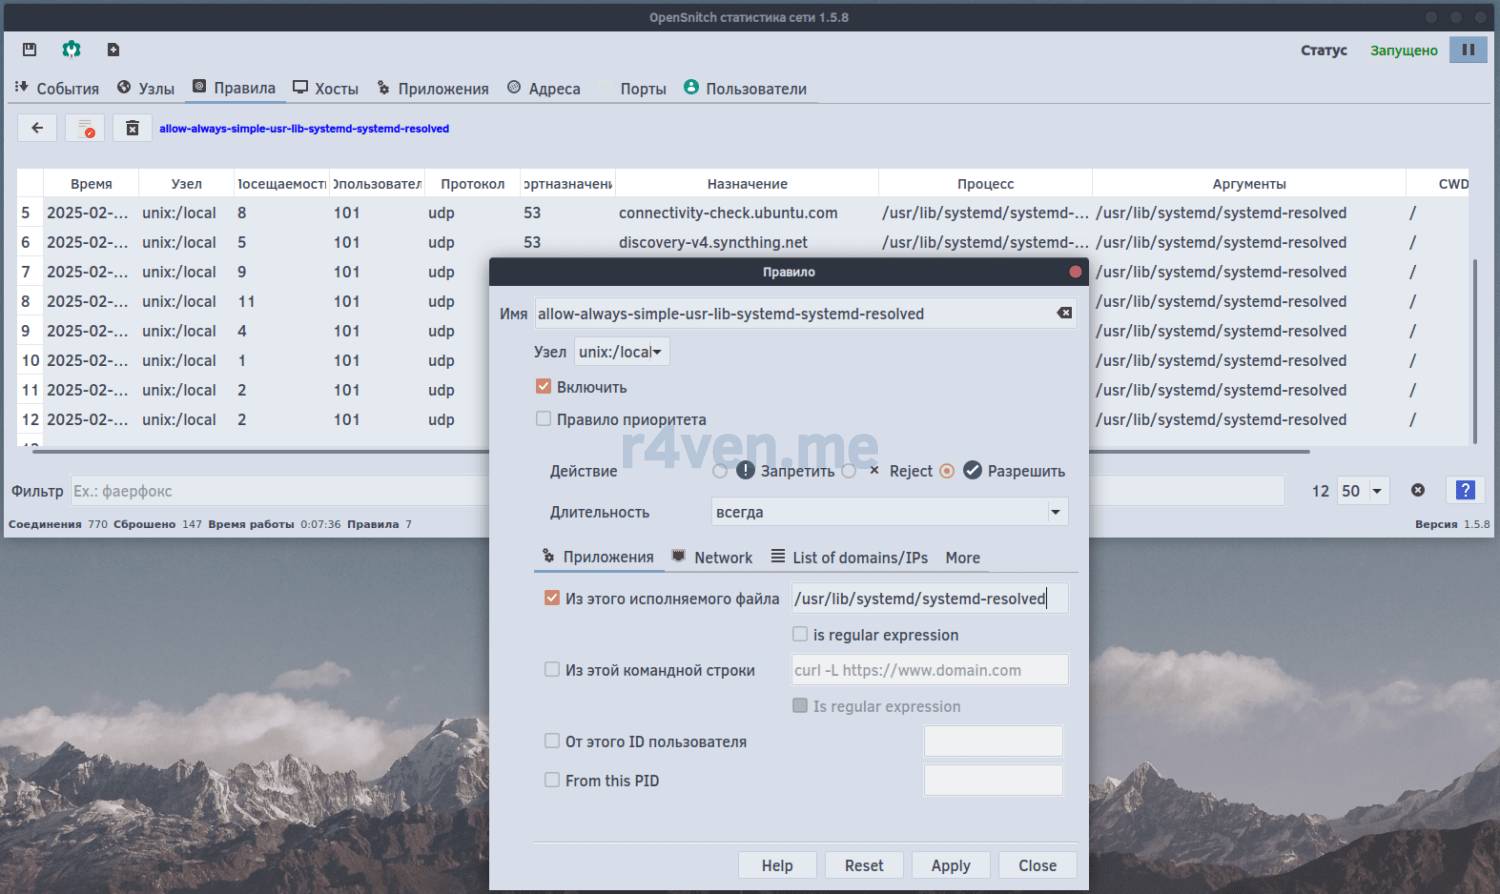
Double-clicking a selected rule takes us to a section showing the network activity related to it. Here, by clicking the edit button (in the top left corner), you can change the conditions of its operation:
“Hosts” tab
This tab shows a list of domain names the system has established connections with, as well as the number of such connections:
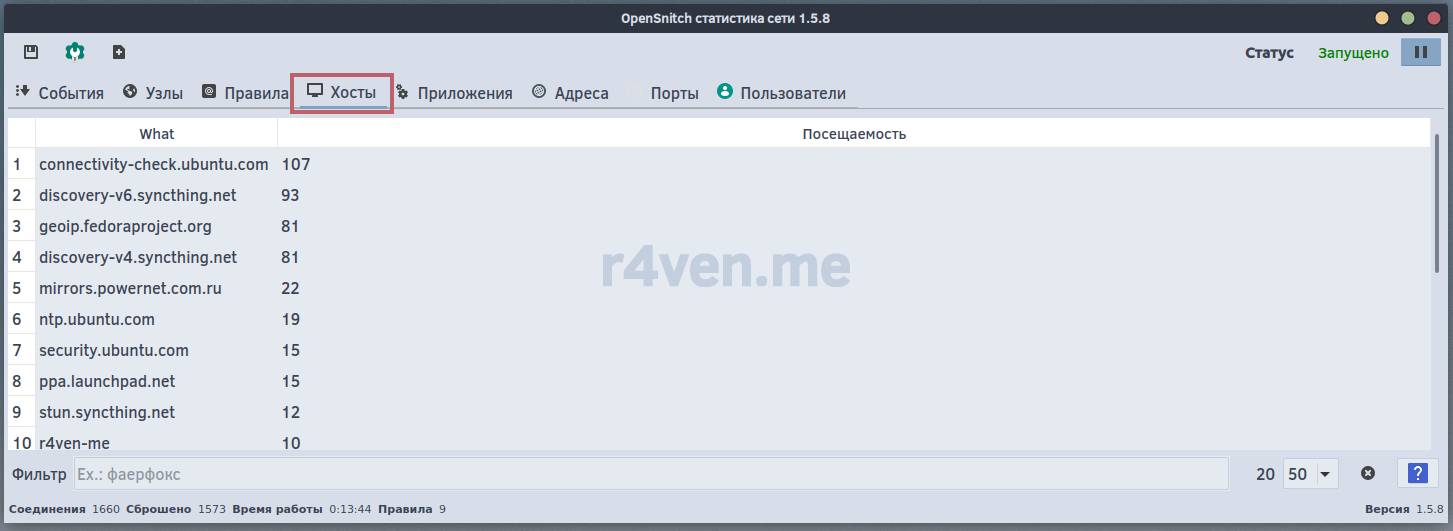
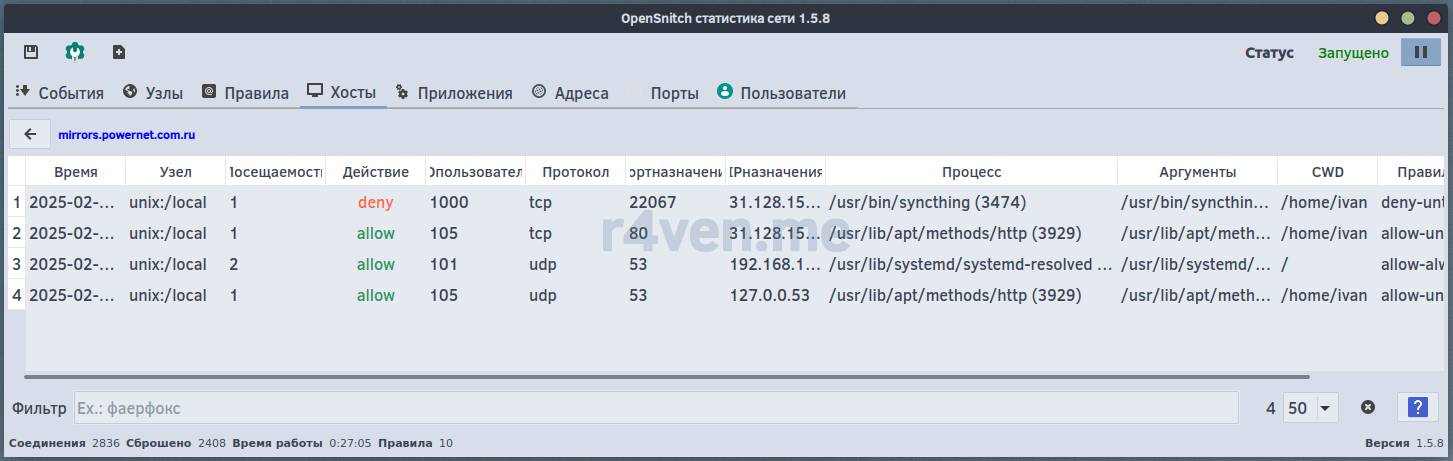
Double-clicking a host lets you see which programs interacted with it:
“Applications” tab
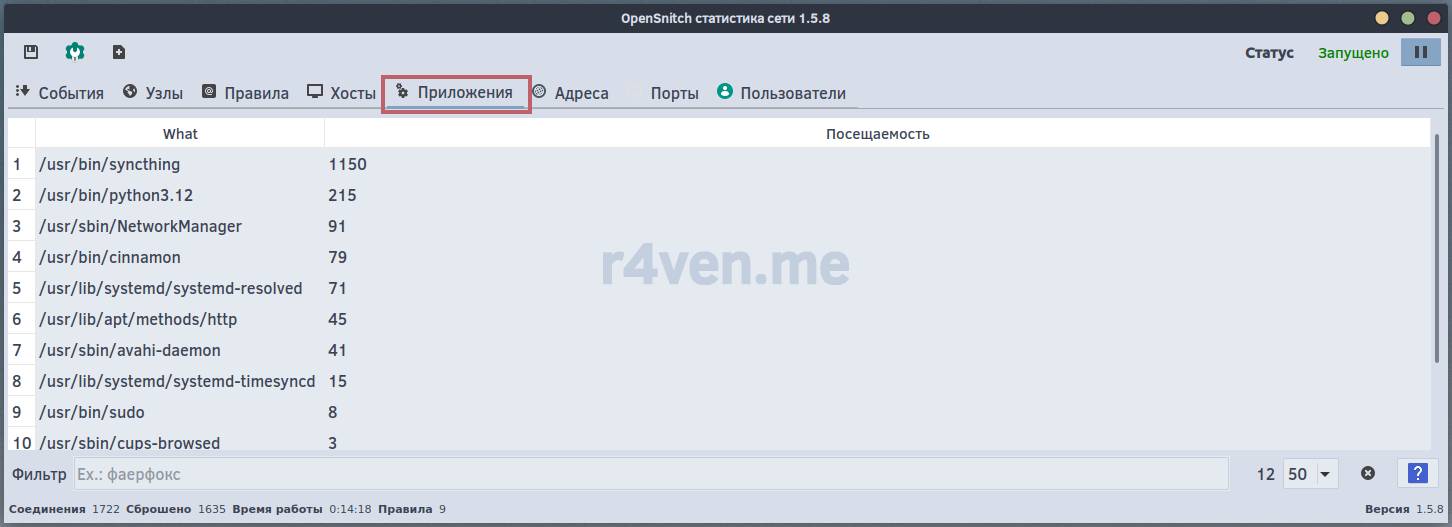
Here’s a list of all programs/utilities that went out to the network and the number of such attempts.
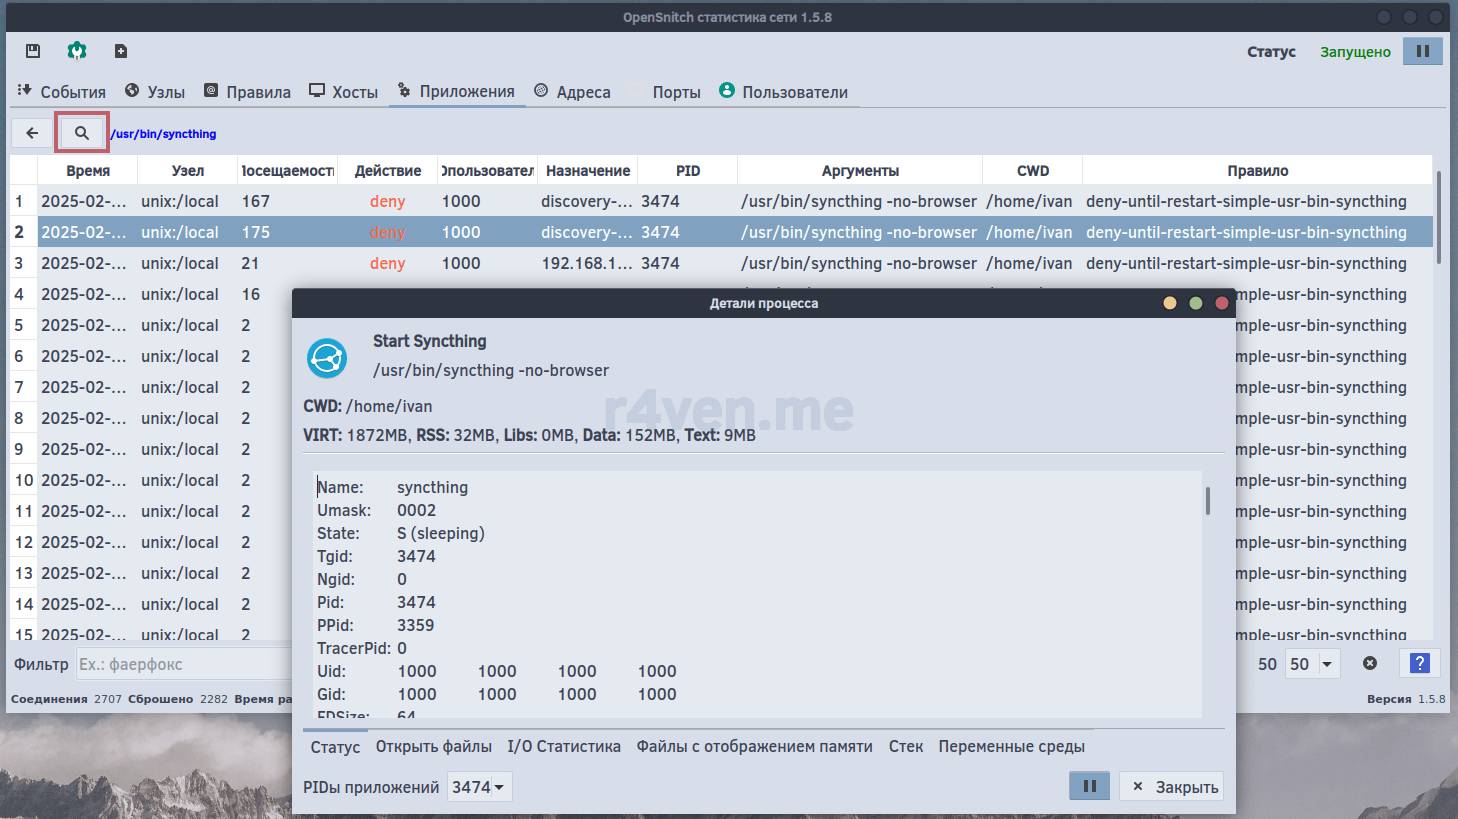
Double-clicking the selected program will open a table of its network activity. And clicking the browse button (magnifier icon) lets you see process details: open files, I/O statistics, environment variables used, etc.:
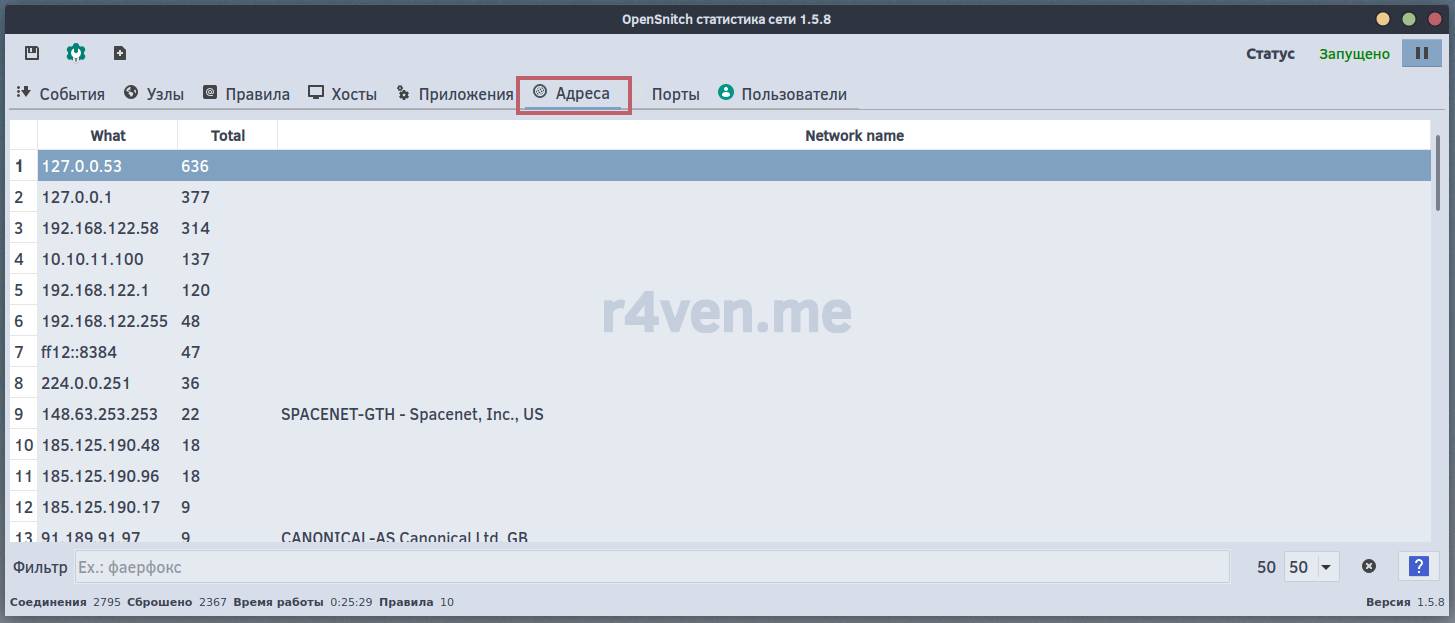
“Addresses” tab
This tab, as expected, shows all the IP addresses of hosts your applications have interacted with:
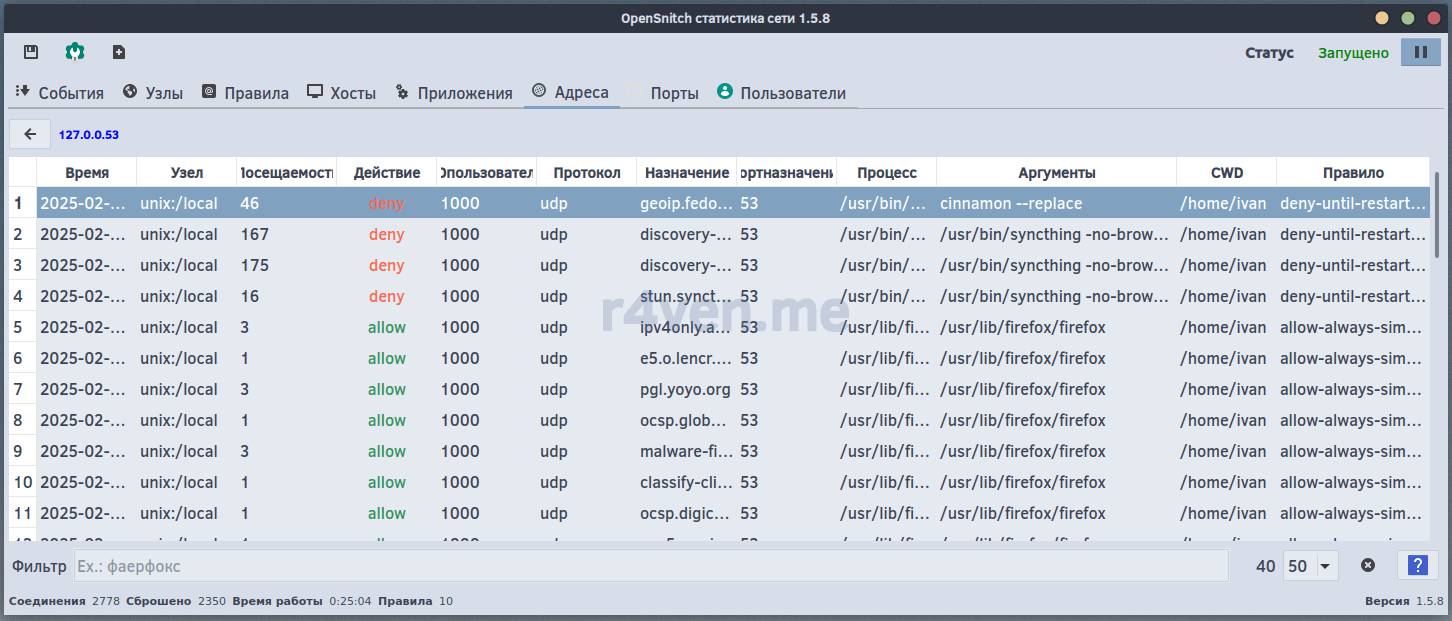
Double-clicking an address lets you see the statistics related to it:
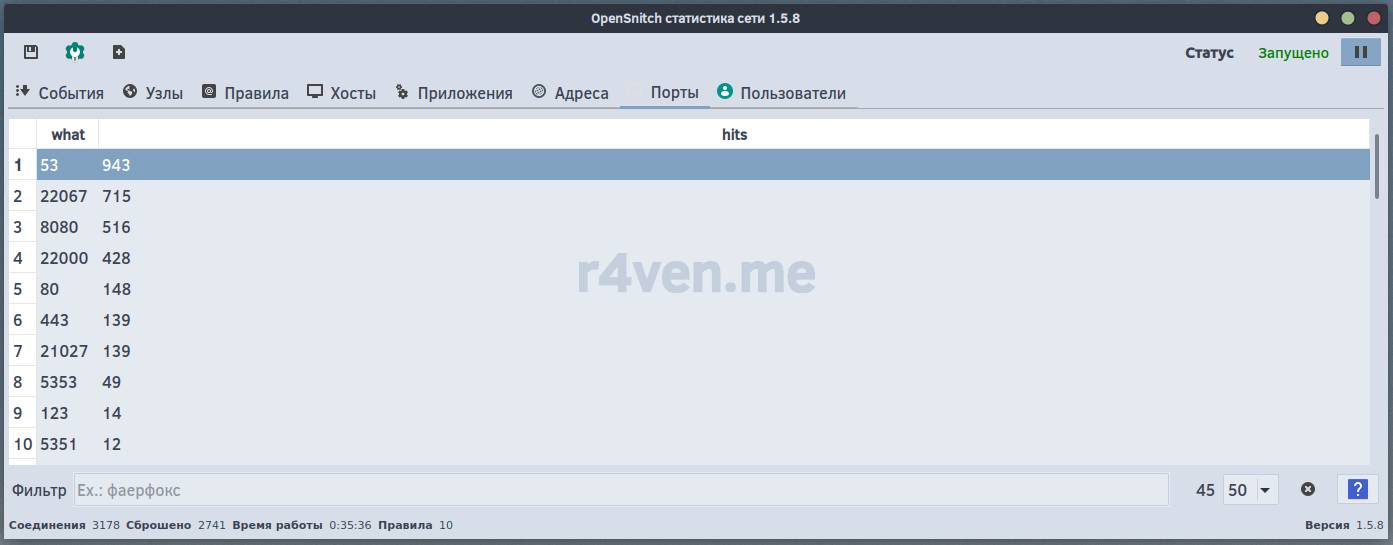
“Ports” tab
This section presents a list of network ports used on the system and the number of accesses to them:
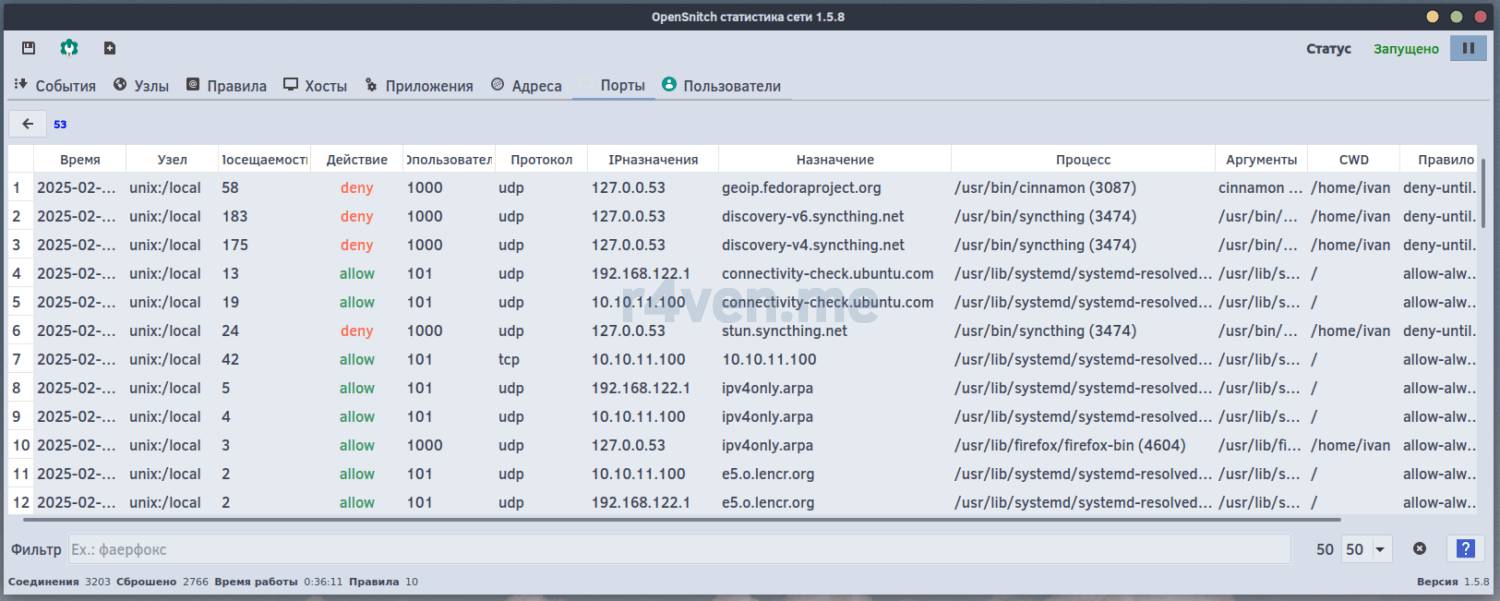
Similar to the “Addresses” tab, double-clicking lets you see details related to the applications that accessed the specified port:
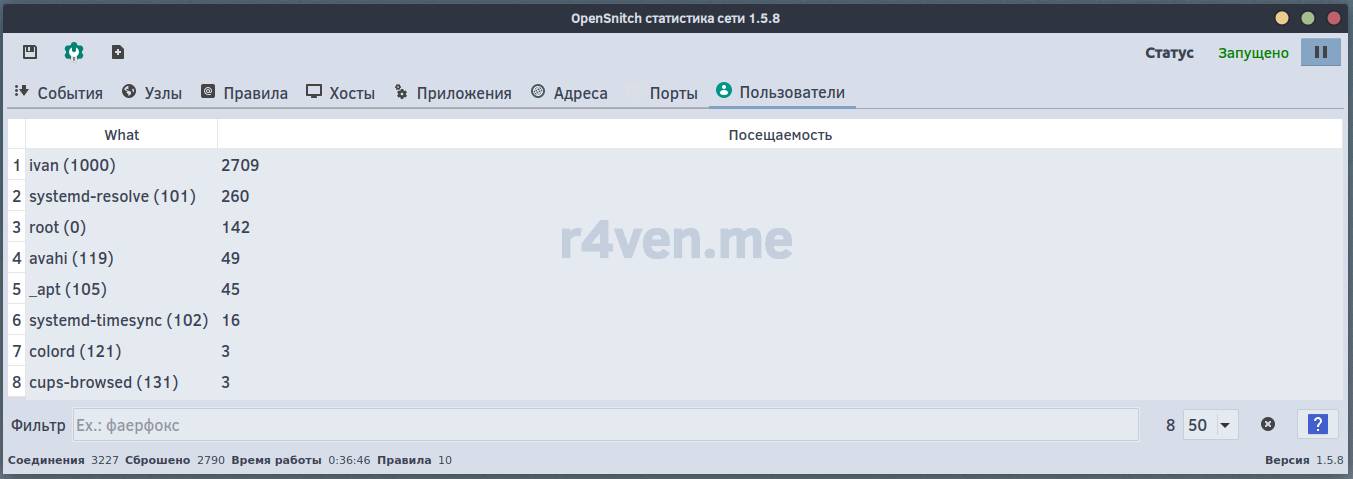
“Users” tab
And here’s a list of the owner users of processes that are actively using the network:
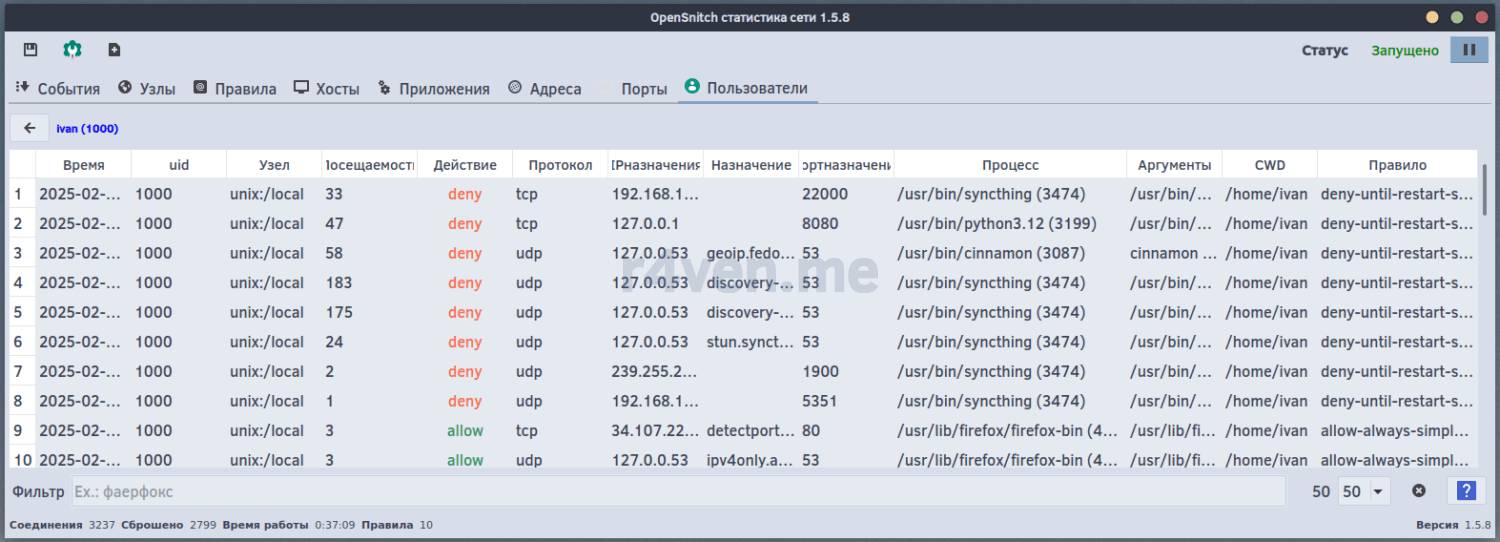
Similarly, double-clicking a user lets you see the processes related to them and their network activity:
Program settings
It remains to look at the OpenSnitch settings section:
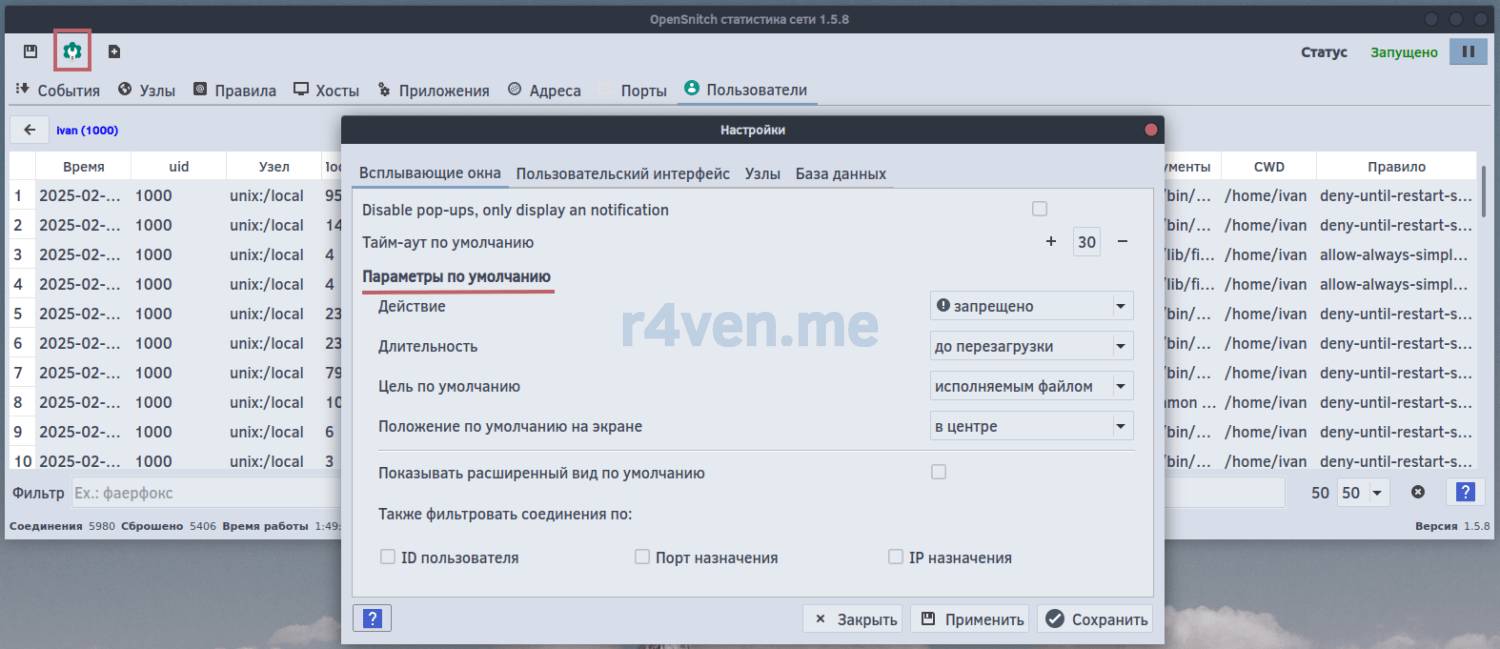
Here you can change the program’s operating parameters:
- Operating mode: you can disable interactive mode (notifying the user on every new connection) and use automatic mode (applying default parameters);
- Default parameters: you can define the request type, action, and rule duration;
- Logging: configure the log detail level, specify the log file (default
/var/log/opensnitchd.log); - Control method: choose between
proc,auditd, oreBPF(eBPF is more efficient and recommended for modern systems); - Database: configure storing events in a separate file;
- and others.
Afterword
Now our arsenal has +1 to paranoia our system’s protection complex 🧑💻🛡️. Personally, OpenSnitch turned out to be a very convenient, flexible, and effective way to monitor how applications work, as well as to prevent unwanted network activity on the system. It’s amazing when you look at the list of processes trying to gain network access 😱.
If this note turned out to be useful to you, check out the Useful software section, you might be interested in my other materials as well.
Thanks for reading! And take care of your privacy 🥷.
Useful materials
- Official OpenSnitch project website | GitHub
- OpenSnitch project wiki | GitHub
- OpenSnitch releases page | GitHub
- “Useful software” section | Raven blog
👨💻And…
Don’t forget about our Telegram channel 📱 and chat
Or maybe you want to become a co-author? Then click here🔗
💬 All the best ✌️
That should be it. If not, check the logs 🙂

Comments