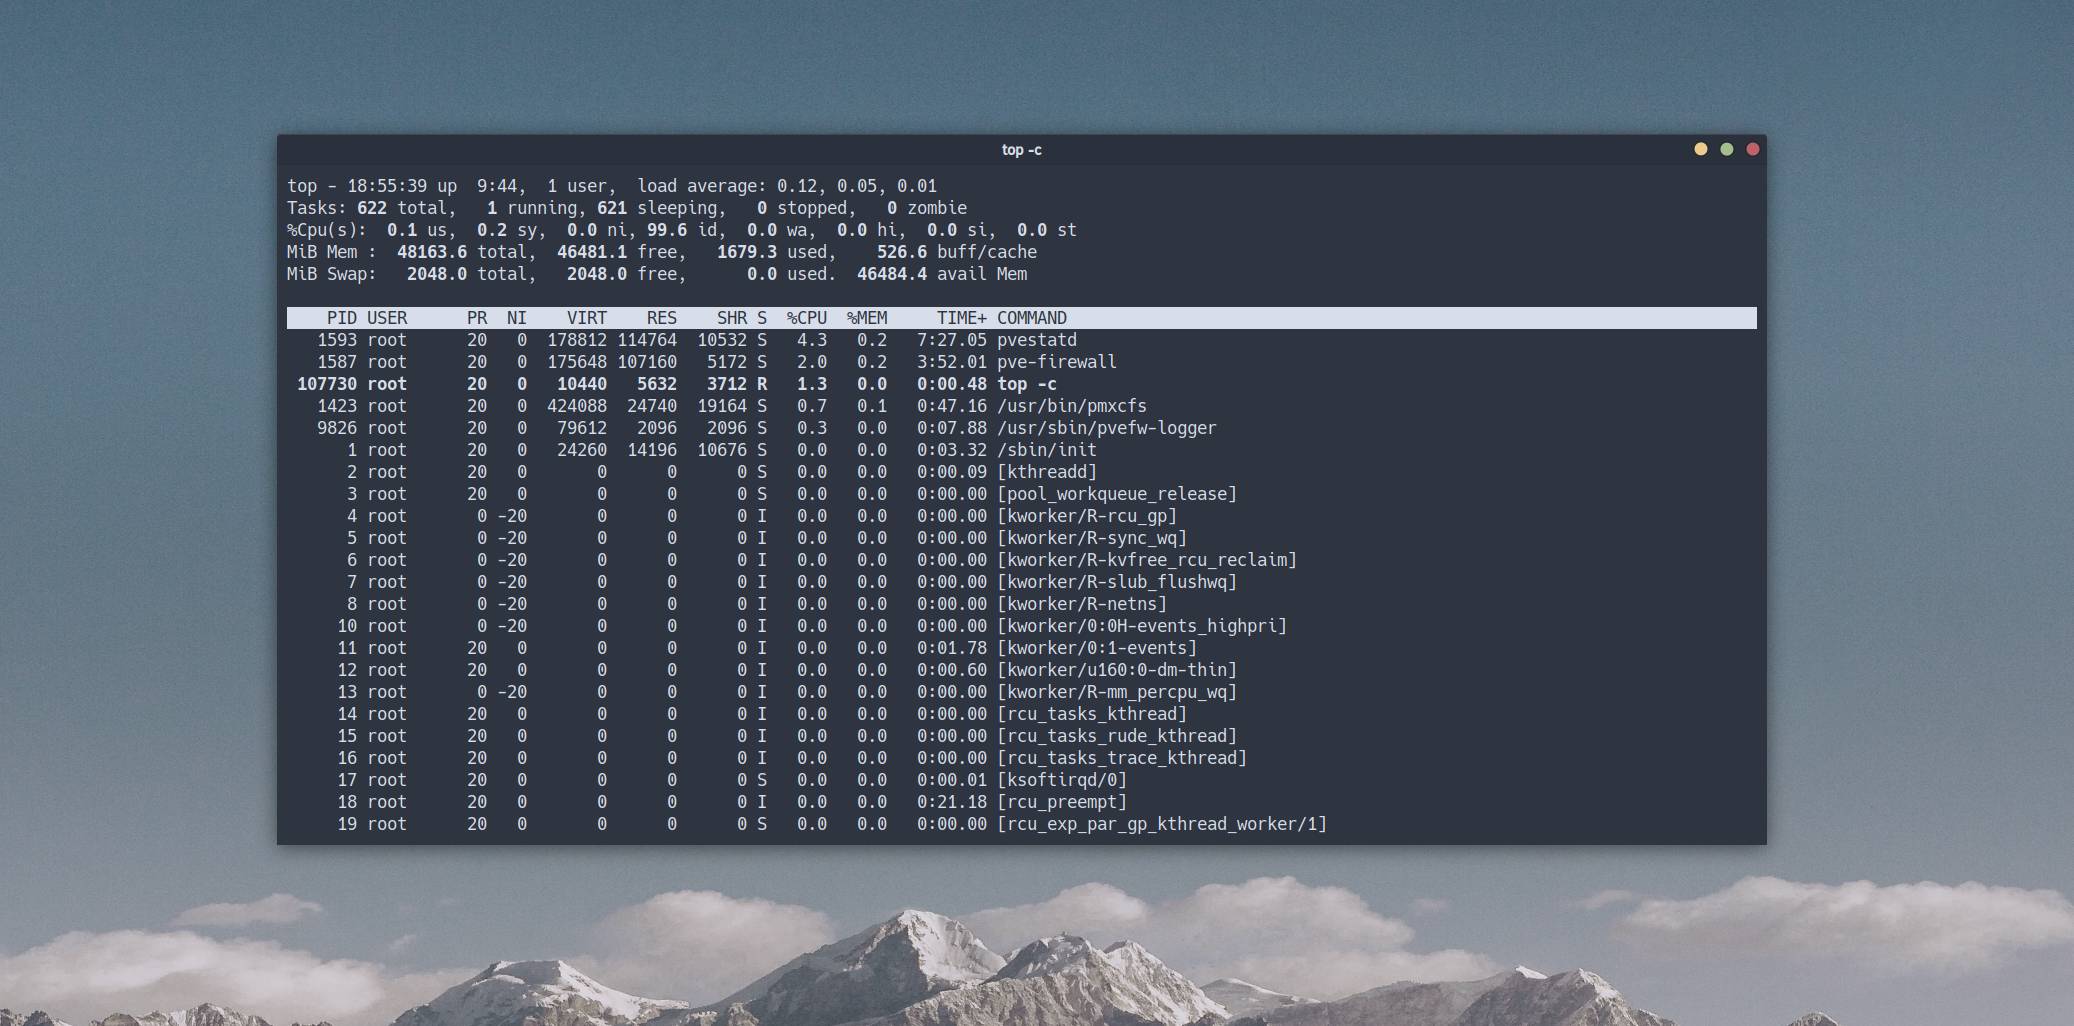
In this theoretical note, we will take a detailed look at the output of the top command - a utility for basic Linux diagnostics.
🖐️Hey!
Subscribe to our Telegram channel @r4ven_me📱, so you don’t miss new posts on the website 😉. If you have questions or just want to chat about the topic, feel free to join the Raven chat at @r4ven_me_chat🧐.
top is a process manager utility for the Linux command line that provides a dynamic, real-time view of running processes and system resources (CPU, memory).
Every advanced Linux user is strongly recommended to know about top, know how to work with it, and interpret its output.
The metrics displayed in top output are very often asked about in IT interviews☝️.
To call the process manager, simply run:
top -c📝 -c (command) - shows the full process command, including arguments.
Below is a detailed breakdown of this utility’s output.
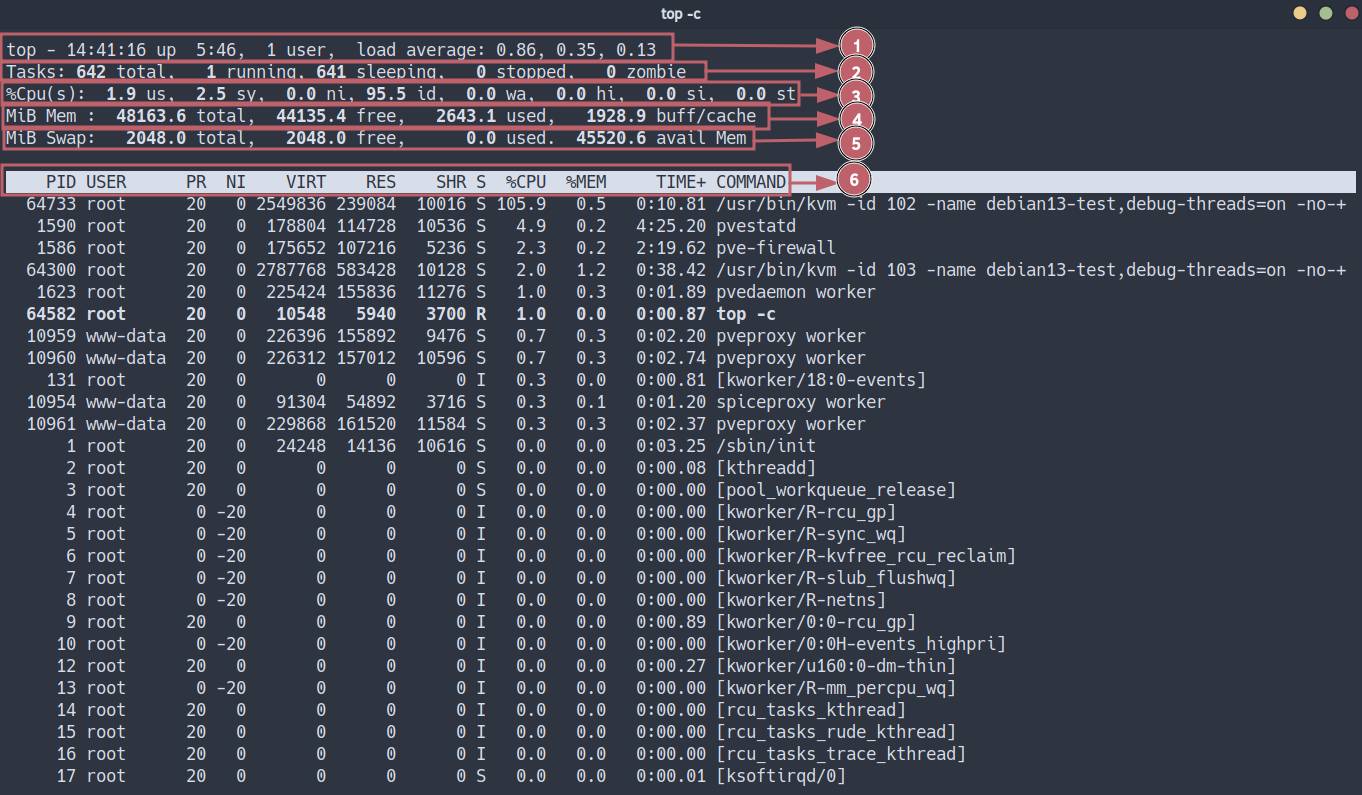
Line 1 - Start Time, Users, and Load Average
top - 14:41:16 up 5:46, 1 user, load average: 0.86, 0.35, 0.13Breakdown of metrics:
14:41:16- current system time;up 5:46- continuous kernel uptime since the last boot;1 user- number of active terminal sessions (tty/pts);load average(LA) - exponentially weighted moving average of the CPU process run queue length over 1, 5, and 15 minutes🤯.
How to interpret it?
LA in Linux is the sum of processes in two states:
- Running/Runnable (
R) - processes running on the CPU or waiting in the ready queue. - Uninterruptible Sleep (
D) - processes waiting for input/output (I/O disk, NFS) or kernel locks.
Cases:
LA < number of cores- the system is operating normally, there is no queue idle time;LA > number of cores- resource contention occurs, delays appear (Latency);High LA + Low CPU Usage- a sign of a bottleneck in the disk subsystem (I/O Wait). Processes are blocked while waiting for data.
Diagnostic commands
w               # Show who is logged in and their current processes
uptime          # Quick LA and uptime output
lscpu           # Check the number of cores (CPU(s)) to evaluate LA correctly
sar -q 1 5 # (sysstat) Run queue length history (runq-sz)Line 2 - Task Summary (Tasks)
Tasks: 642 total, 1 running, 641 sleeping, 0 stopped, 0 zombieBreakdown of metrics:
total- total number of processes running in the system;running- processes that own CPU context right now or are ready to do so;sleeping- processes waiting for a certain event or resource availability;stopped- processes that received a stop signal (SIGSTOP,SIGTSTP);zombie- child processes that have completed execution, whose return code has not yet been read by the parent process.
How to interpret it?
- A large number of
sleepingprocesses is normal for a multitasking OS (daemons, waiting for input); - The presence of
stoppedoften indicates manual debugging or paused jobs (Ctrl+z); zombieprocesses do not consume memory or CPU, but occupy a descriptor in the process table (PID).
Diagnostic commands
# List all processes
ps -ef
# Process tree (helps find the zombie parent)
pstree -p -t -n -C age
# Find zombies and their parent PIDs
ps -eo user,pid,ppid,state,comm | awk 'NR==1 || $4=="Z"'Line 3 - CPU Statistics
%Cpu(s): 1.9 us, 2.5 sy, 0.0 ni, 95.5 id, 0.0 wa, 0.0 hi, 0.0 si, 0.0 stBreakdown of metrics (percentage of time):
us(User) - user-space code (applications, databases, web servers) with standard priority;sy(System) - kernel-space code (system calls, drivers, memory management);ni(Nice) - user-space code with changed priority (renice);id(Idle) - processor idle time;wa(I/O Wait) - CPU idle time while the system waits for input/output operations to complete (disk/network);hi(Hardware Interrupts) - handling hardware interrupts (network cards, disk controllers), CPU time spent processing signals from hardware;si(Software Interrupts) - handling software interrupts (softirqs, scheduler, RCU), CPU time spent on deferred processing of kernel tasks;st(Steal Time) - time “stolen” by the hypervisor for other virtual machines (relevant only for VMs).
How to interpret it?
High sy (>20%)- inefficient system calls, driver problems, a huge number of context switches;High wa- the bottleneck is the disk; the processor is idle while waiting for data;High si- often indicates a network storm (packet load) or TCP/IP stack overload;High st- “noisy neighbors” on the physical host, possibly shared resource use with other VMs.
Diagnostic commands
mpstat -P ALL 1     # (sysstat) Load per each core separately
cat /proc/interrupts # View interrupt counters (for hi/si diagnostics)
dmesg | tail        # Kernel logs (driver, hardware errors)
iostat -xz 1 # Detailed disk statistics (for wa diagnostics)Line 4 - Memory (Physical RAM)
MiB Mem: 48163.6 total, 44135.4 free, 2643.1 used, 1928.9 buff/cacheBreakdown of metrics:
total- total amount of physical memory;free- memory that does not contain any data;used- used memory, calculated astotal - free - buff/cache;buff/cache:buffers- memory that contains superblocks, bitmaps, group descriptors, inode, dentry, and others;cache- memory that contains page cache: file contents from disk cached in RAM;
avail(available) - estimate of memory available for starting new applications without going into swap (space that can be freed instantly).
How to interpret it?
- Linux follows the principle: “Free memory is wasted memory.”
- High buff/cache is normal. Linux caches disk operations, thereby speeding up disk access. If memory is needed, the kernel will instantly clear cache pages.
- Constant growth of
usedwhileavaildecreases may indicate a memory leak.
Diagnostic commands
free -h            # Classic memory output
vmstat -s          # Detailed memory event statistics
slabtop # Kernel object cache analysis (dentry, inodes)Line 5 - Memory (swap)
MiB Swap: 2048.0 total, 2048.0 free, 0.0 usedDisk space used to unload inactive memory pages from RAM.
Breakdown of metrics:
total- total swap;free- free swap;used- used swap.
How to interpret it?
- used > 0, but stable: the kernel unloaded long-unused pages to free RAM, for example for disk cache. This is normal behavior.
- Active growth of used + growth of wa: thrashing - the system spends more time moving data between RAM and disk than doing useful work. It is accompanied by a critical performance drop.
Diagnostic commands
swapon -s          # Show active swap partitions and priorities
vmstat 1 # si (swap in) and so (swap out) columns - if not 0, active swapping is happeningLine 6 - Process Table
PID USER PR NI VIRT RES SHR S %CPU %MEM TIME+ COMMANDColumn breakdown:
PID(Process ID) - unique process identifier;USER- effective user identifier (EUID) under which the process is running;PR(Priority) - dynamic priority of the kernel scheduler (RT - Real Time);NI(Nice) - “niceness” value (-20 - highest priority, +19 - lowest). AffectsPR;VIRT(Virtual Image) - virtual amount of memory reserved by the process (code + data + shared libraries + pages in swap). Does not show real physical RAM consumption;RES(Resident Size) - physical memory used by the process that has not been swapped out (code + data). Main RAM consumption metric;SHR(Shared Mem) - part of RES memory that can be shared with other processes (glibc libraries and others);TIME+- total CPU time spent by the process, accurate to hundredths of a second;COMMAND- process launch command.
Process States (S Column)
This is the most important column for deep diagnostics.
| Code | Status (State) | Technical description | Interpretation |
|---|---|---|---|
R | Running | Running or Runnable | The process is either executing on a core or is in the scheduler queue (Run queue). |
S | Sleeping | Interruptible Sleep | Waiting for an event (input completion, timer, signal). Can be interrupted by a signal. |
D | Disk Sleep | Uninterruptible Sleep | The process is waiting for a response from hardware (usually I/O). It cannot be killed (kill -9 will not work) until the driver returns control. Accumulation of D processes raises Load Average. |
Z | Zombie | Zombie | The process has finished (exit()), memory has been freed, but an entry remains in the process table because the parent has not called wait(). |
T | Stopped | Stopped | Stopped by a job-control signal (SIGSTOP/SIGTSTP) or debugger (ptrace). |
t | Tracing | Tracing stop | Stopped by a debugger during tracing. |
I | Idle | Idle (Kernel thread) | Kernel thread in idle mode (not counted in Load Average). Usually [kworker] processes. |
Process diagnostic commands
pidstat -r -p <PID> 1   # Detailed memory statistics for a specific PID (including leaks)
pidstat -d -p <PID> 1   # I/O statistics for a specific process (who is writing to disk?)
strace -p <PID>         # (Advanced) Intercept system calls, shows what the process is doing right now
pmap -x <PID>           # Process memory map
iotop -o -P -d 5        # Interactive I/O monitor by process (find D-state culprits)
kill -9 <PID>           # Forced termination (SIGKILL)
renice -n 10 -p <PID> # Lower process priority "on the fly"Useful Keyboard Shortcuts in Interactive top
P- sort by CPU;M- sort by memory;T- sort by TIME+;c- show full command path/arguments;u- filter by user;k- send a signal (kill);r- renice;H- show threads;f- select/disable columns;o- set sort order;1- show separate load for each core;z- enable color display.
A useful command for output to a script/log (non-interactive):
top -b -n 1 It captures the state of all processes at the time of execution.
There are also popular managers htop - more convenient interactively, and atop, which can save metric history, but that is another story😉.
Read more about process management in a separate article: 🔗 Linux Command Line, Processes: jobs, fg, bg, ps, pgrep, kill, pkill, htop Commands
An Interesting Case from the Chat
Could you comment on this top?) Only 1 running process, on 8 cores it loads them all, but LA is almost 100. At the same time, the server is quite responsive to commands and does not look overloaded.
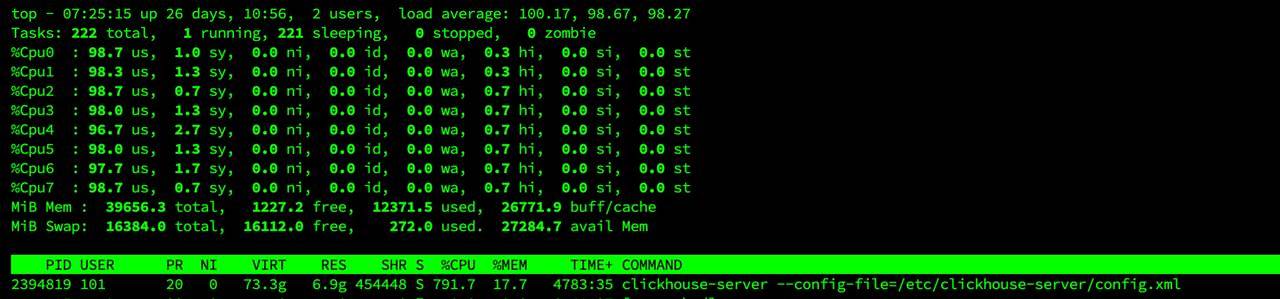
I often observe this situation on VMware in virtual machines with processes that really love CPU, but at the same time no CPU limit is set for the created virtual machine - in VMware this is set through a frequency limit in MHz - the processor core frequency is multiplied by the number of cores - this is the total resource available to all virtual machines, and you can set a VM limit in MHz above which it cannot consume. Ideally, make it equal to the number of cores allocated to the virtual machine. Otherwise, it can eat all available free CPU resources, taking them implicitly from other virtual machines, which is what we see here.
This can be seen in VMware monitoring: the virtual machine consumes more than 100% CPU - in my specific example it was 125%. At the same time, apparently, the load average calculation breaks when it sees that processes consume more CPU time than can even be available ) I have seen load average of 800 and higher on 8 cores on heavy mathematical calculators, while real consumption was 2 times higher than the allocated resources. This was a kind of life hack, because the license allowed using only 8 cores there)
👨💻And…
Don’t forget about our Telegram channel 📱 and chat
Or maybe you want to become a co-author? Then click here🔗
💬 All the best ✌️
That should be it. If not, check the logs 🙂