In this guide we will deploy the popular Zabbix monitoring system using TimescaleDB — a plugin for the PostgreSQL database that allows efficient work with “time series”. We’ll wrap all this goodness inside docker containers 🐳. It’s going to be interesting 😉.
Let me remind you that in one of the previous posts we discussed what monitoring systems in IT are, what kinds exist, and learned a bit about popular implementations today, among which is Zabbix.
🖐️Hey!
Subscribe to our Telegram channel @r4ven_me📱, so you don’t miss new posts on the website 😉. If you have questions or just want to chat about the topic, feel free to join the Raven chat at @r4ven_me_chat🧐.
Right away, please note that all actions described in this guide are performed at your own risk and responsibility. My blog is just a platform where I talk about my experience and share my opinion on various things and phenomena. Thanks for understanding.
Ivan Cherniy
Introduction
The distinctive feature of the installation described in this article is not just deploying the Zabbix monitoring system in docker containers, but also using it in conjunction with a time series database — TimescaleDB.
Before we begin, let’s give a few definitions as an introduction.
Zabbix is an open platform for monitoring networks and servers. It uses relational DBMSs for data storage, for example: PostgreSQL, MySQL, MariaDB, Oracle, SQLite, etc.
Time series in databases is a set of data ordered by time, where values are recorded at equal or unequal time intervals.
Time series databases are specialized databases designed for efficient storage, management, and analysis of time series. These are often no sql databases.
TimescaleDB (TSDB) is an extension for PostgreSQL that optimizes working with time series in this DBMS, while preserving all the power and flexibility of classic SQL-like databases. Since some time, Zabbix has learned to work with this DBMS.
A quote from the official Zabbix documentation:
Zabbix supports TimescaleDB, a PostgreSQL-based database solution of automatically partitioning data into time-based chunks to support faster performance at scale.
Zabbix.com
For a better understanding of the reasoning behind this particular combination, I recommend an article on Habr: Zabbix, time series and TimescaleDB.
I also ask you to pay attention to the warning from the official Zabbix documentation:
Warning: Currently, TimescaleDB is not supported by Zabbix proxy.
Zabbix.com 09.2024
I’m sure this will be fixed in the future. But enough talk for now, let’s get down to business 🤵♂️.
Preparation
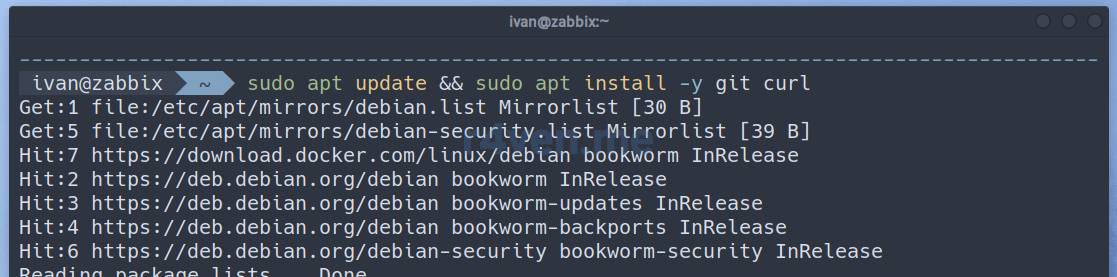
We’ll deploy Zabbix in an environment based on the Debian 12 💿 distribution with Docker engine 🐳 installed. If you don’t already have a ready Linux server, I recommend my previous articles:
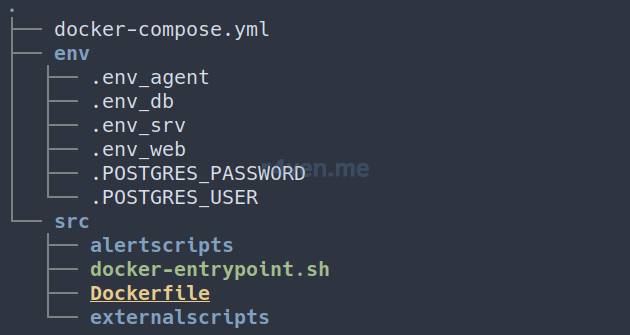
Click here to view a description of the project files
docker-compose.yml — a file describing the services launched in docker containers:
NETWORK section — defines two virtual docker networks:
zbx_net_backend — an isolated network for interaction between the postgres-server,zabbix-server, zabbix-web, and zabbix-agent containers;
zbx_net_frontend — a network with access to containers from the host OS: for the zabbix-server and zabbix-web containers.
SERVICES section — defines the parameters of the running services/containers:
postgres-server — the TimescaleDB DBMS service;
zabbix-server — the Zabbix server service;
zabbix-web — the web interface service for the Zabbix server (under the hood nginx + php-fpm);
zabbix-agent — the Zabbix agent service for collecting metrics from the Zabbix server itself.
SECRETS section — defines files containing sensitive information that are passed into the postgres-server, zabbix-server, and zabbix-web containers:
POSTGRES_USER (file ./env/.POSTGRES_USER) — the username for the Zabbix database in the TimescaleDB DBMS;
POSTGRES_PASSWORD (file ./env/.POSTGRES_PASSWORD) — accordingly, the user’s password.
env — a directory with files containing environment variables whose values are passed into the container at startup:
.env_db — parameters for postgres-server;
.env_srv — parameters for zabbix-server;
.env_web — parameters for zabbix-web;
.env_agent — parameters for the local zabbix-agent;
.POSTGRES_PASSWORD — the user’s password in the zabbix DB;
.POSTGRES_USER — the username in the zabbix DB.
src — a directory with source files for building the custom zabbix-server container with extended functionality:
alertscripts — a directory with files for sending notifications to Telegram:
docker-entrypoint.sh — a script for preparing the environment inside the container (unchanged);
Dockerfile — a customized image build description file;
externalscripts — a directory with a domain delegation monitoring script.
If needed, edit the deploy block for the relevant services in the docker-compose.yml file, depending on the server resources you have available. By default, the most minimal values are used.
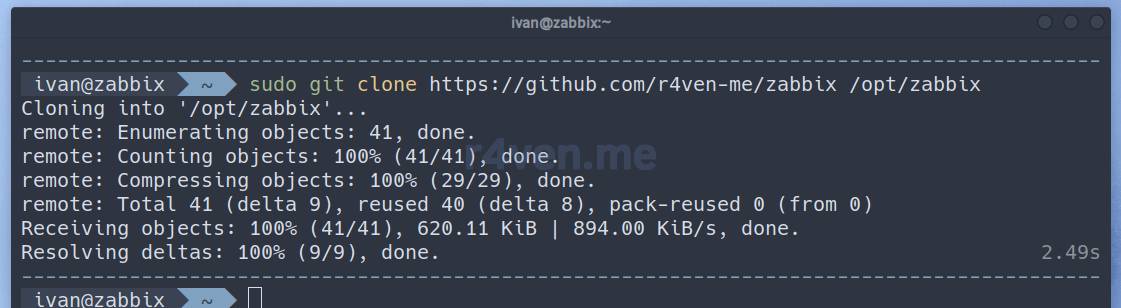
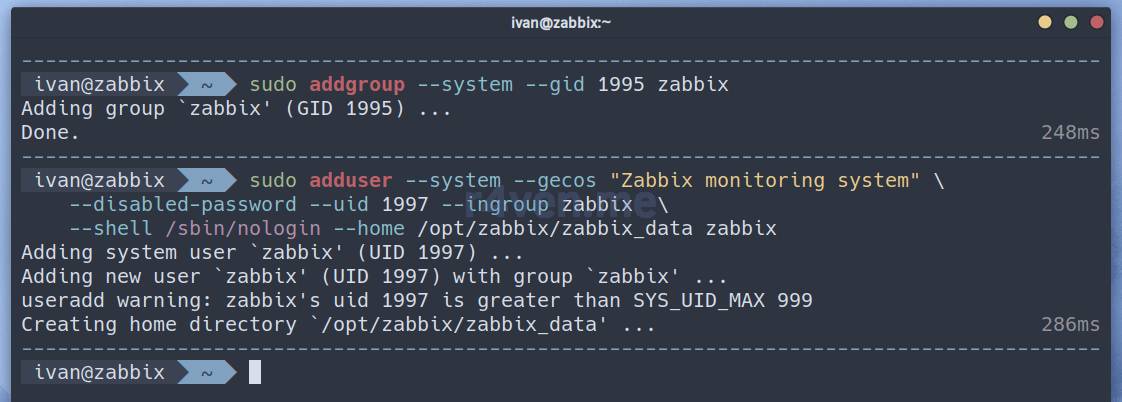
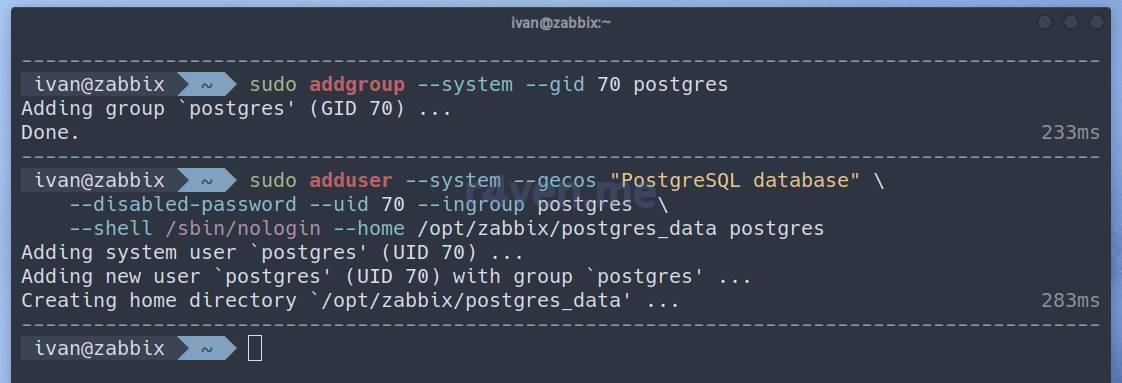
Creating the zabbix service user
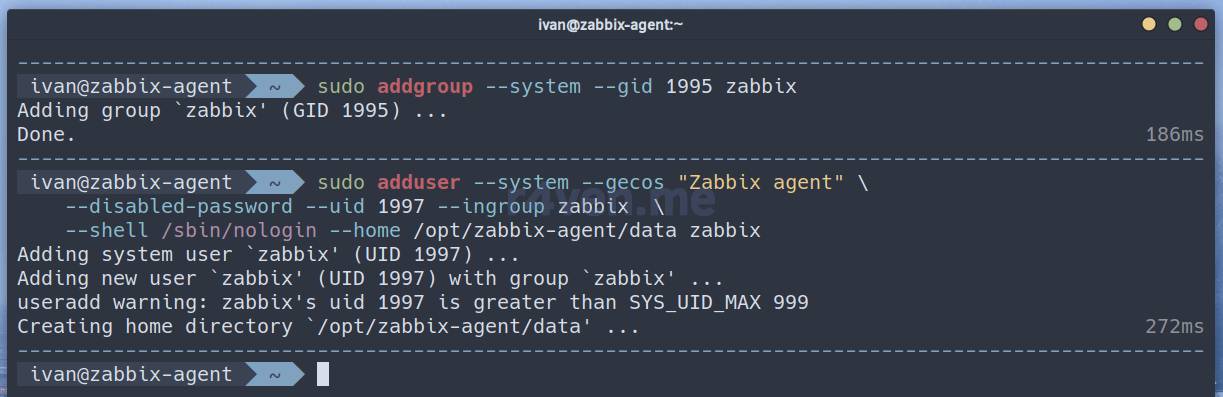
For security purposes, we create a restricted group and a service user to run the zabbix containers:
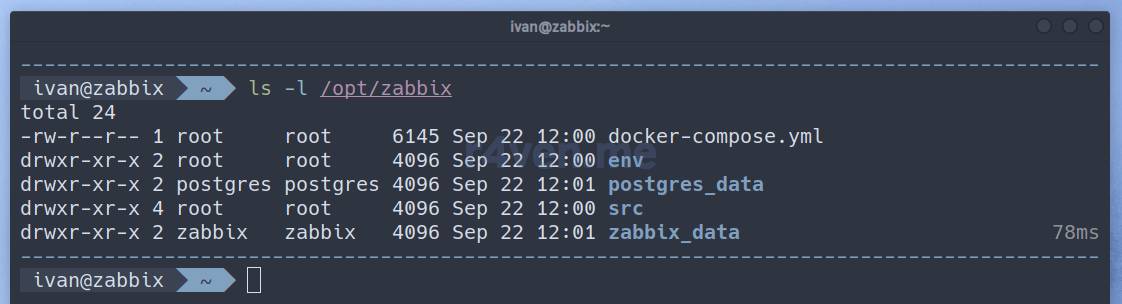
Let’s check that all the necessary files and folders are present:
BASH
ls -l /opt/zabbix
Click to expand and view more
Great, let’s move on 🚶.
Creating a password for the Postgres database
By default, in the file /opt/zabbix/env/.POSTGRES_PASSWORD I set a password of the same name for the zabbix DB. But I highly recommend generating a new one, for example with a command like this:
BASH
tr -cd "[:alnum:]" < /dev/urandom | head -c 30\
| sudo tee /opt/zabbix/env/.POSTGRES_PASSWORD
Click to expand and view more
Click here to view a description of the command
The tr -cd command, using the standard stream redirection mechanism, takes as input Latin letters and digits (the [:alnum:] character class) generated by the /dev/urandom pseudo-device. Then the head command, receiving data via the pipe, uses the -c flag to pick the first 30 characters (bytes). And finally, the resulting pseudo-random string is passed as input to the tee command, run as superuser. tee writes the received data to the specified file (/opt/zabbix/env/.POSTGRES_PASSWORD) and duplicates the output to the standard stream (stdout).
Don’t pay attention to the % character at the end of the line in my example. This is a feature of the ZSH shell, which prints it (or # for root) when there is no newline character.
Launching the Zabbix stack with docker compose
Starting the Postgres server
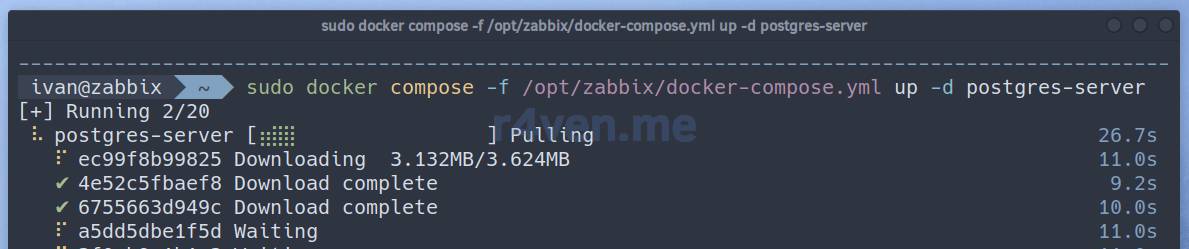
First we start the DBMS server, with this command:
BASH
sudo docker compose -f /opt/zabbix/docker-compose.yml up -d postgres-server
Click to expand and view more
After the image is downloaded and the container started, let’s look at its output:
BASH
sudo docker logs -f postgres-server
Click to expand and view more
On a successful start, you’ll see something like this:
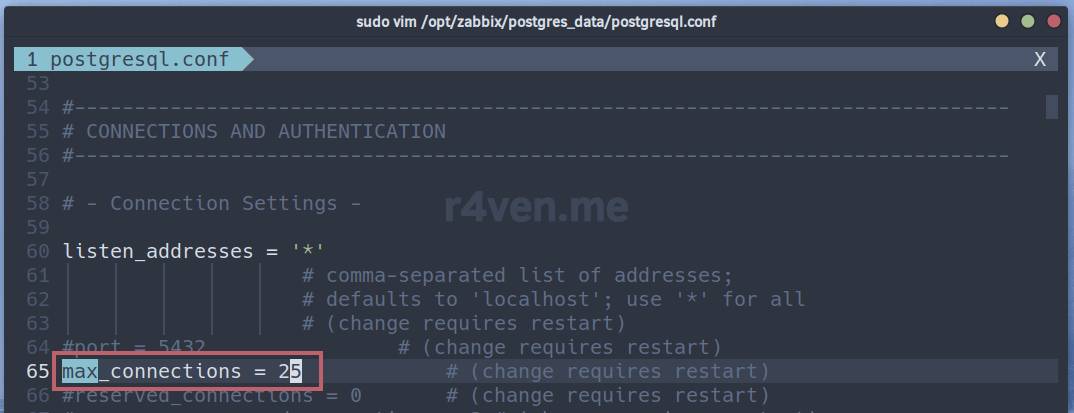
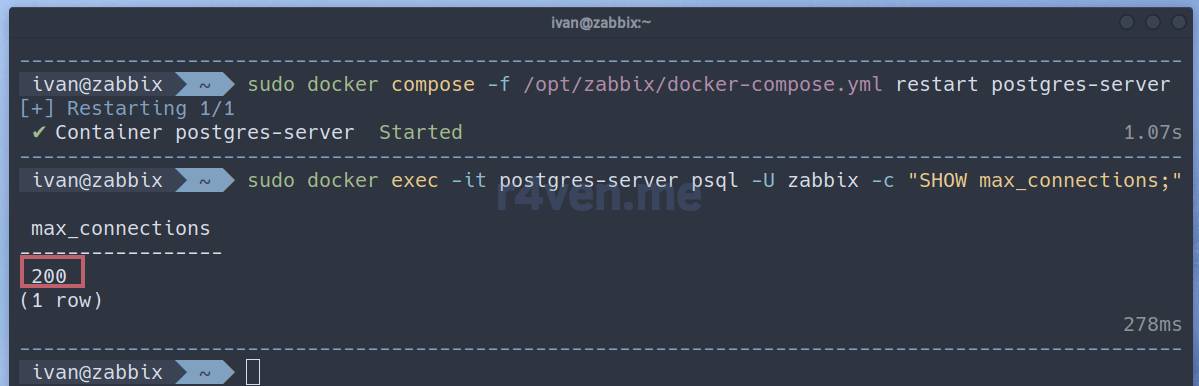
On the first start, scripts for preparing the environment and basic DBMS configuration run inside the container, depending on the server’s parameters. In one of my tests, such a script set the max_connections parameter to 25 — which is not enough even to import the zabbix DB schema, and the process will fail with an error:
BASH
FATAL: sorry, too many clients already
Click to expand and view more
You can check the max_connections value with this command:
Everything is applied, let’s move on to starting the zabbix-server container.
Starting the Zabbix server
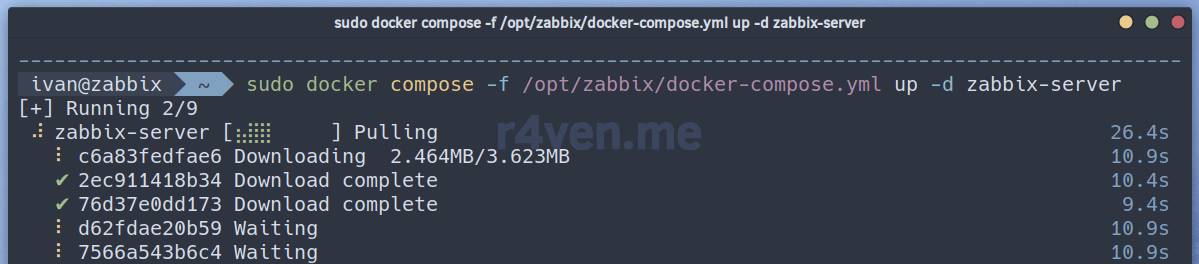
Start it with this command:
BASH
sudo docker compose -f /opt/zabbix/docker-compose.yml up -d zabbix-server
Click to expand and view more
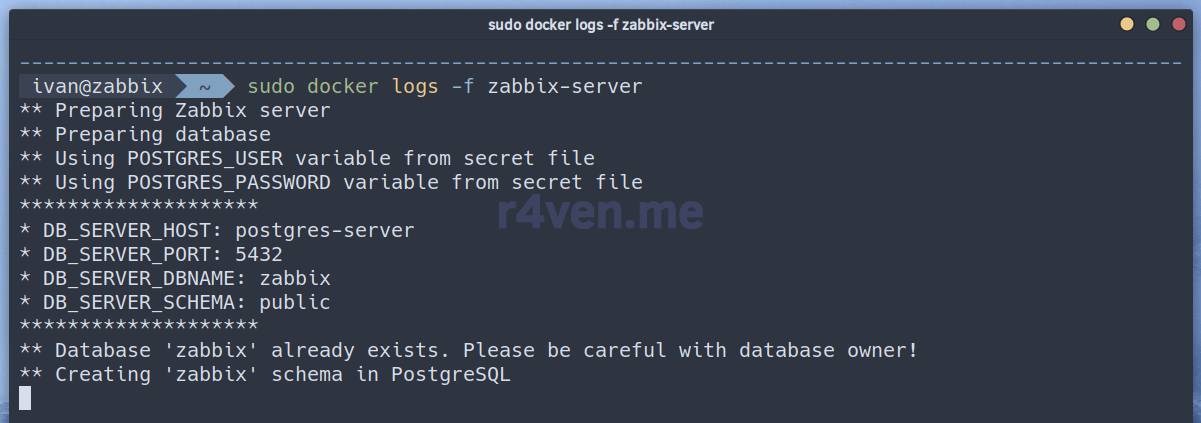
Let’s look at the container’s output:
BASH
sudo docker logs -f zabbix-server
Click to expand and view more
On the first start, the container will begin creating the database. This will take some time. The output will pause at this line:
PLAINTEXT
Creating 'zabbix' schema in PostgreSQL
Click to expand and view more
Make sure you wait for the database creation process to finish!
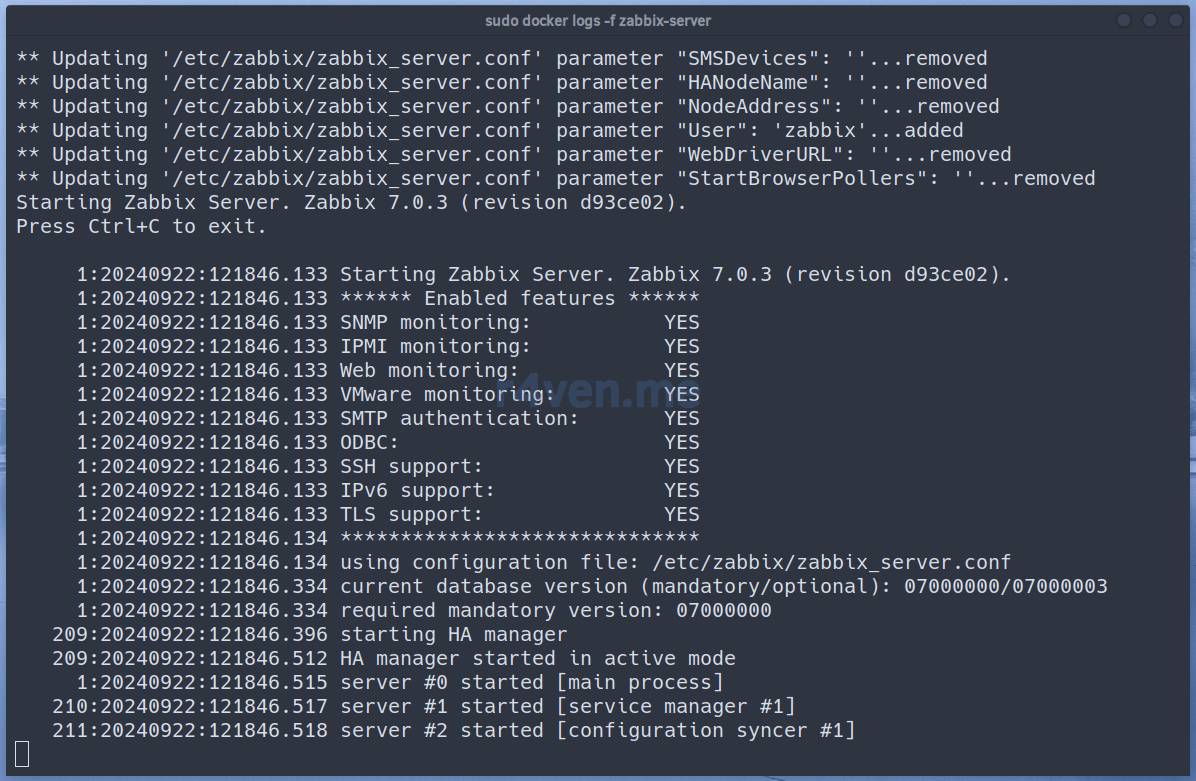
On a successful start you should see something like this:
At the very end there may be output like this:
PLAINTEXT
256:20240922:121849.602 Zabbix agent item "system.cpu.util[,system]" on host "Zabbix server" failed: first network error, wait for 15 seconds
225:20240922:121855.944 item "Zabbix server:zabbix[vmware,buffer,pused]" became not supported: No "vmware collector" processes started.
225:20240922:121858.958 item "Zabbix server:zabbix[process,report writer,avg,busy]" became not supported: No "report writer" processes started.
225:20240922:121859.962 item "Zabbix server:zabbix[process,report manager,avg,busy]" became not supported: No "report manager" processes started.
256:20240922:121904.599 Zabbix agent item "system.users.num" on host "Zabbix server" failed: another network error, wait for 15 seconds
256:20240922:121919.602 Zabbix agent item "system.cpu.load[all,avg5]" on host "Zabbix server" failed: another network error, wait for 15 seconds
225:20240922:121928.010 item "Zabbix server:zabbix[connector_queue]" became not supported: connector is not initialized: please check "StartConnectors" configuration parameter
225:20240922:121929.016 item "Zabbix server:zabbix[process,connector manager,avg,busy]" became not supported: No "connector manager" processes started.
225:20240922:121930.021 item "Zabbix server:zabbix[process,connector worker,avg,busy]" became not supported: No "connector worker" processes started.
256:20240922:121934.600 temporarily disabling Zabbix agent checks on host "Zabbix server": interface unavailable
Click to expand and view more
Don’t pay any attention to it.
Let’s check the status of the running containers:
BASH
sudo docker ps
Click to expand and view more
All good — let’s move on.
Creating the schema for TimescaleDB
Let’s print the password we created earlier to the terminal, we’ll need it soon. Then let’s connect to the shell of the zabbix-server container:
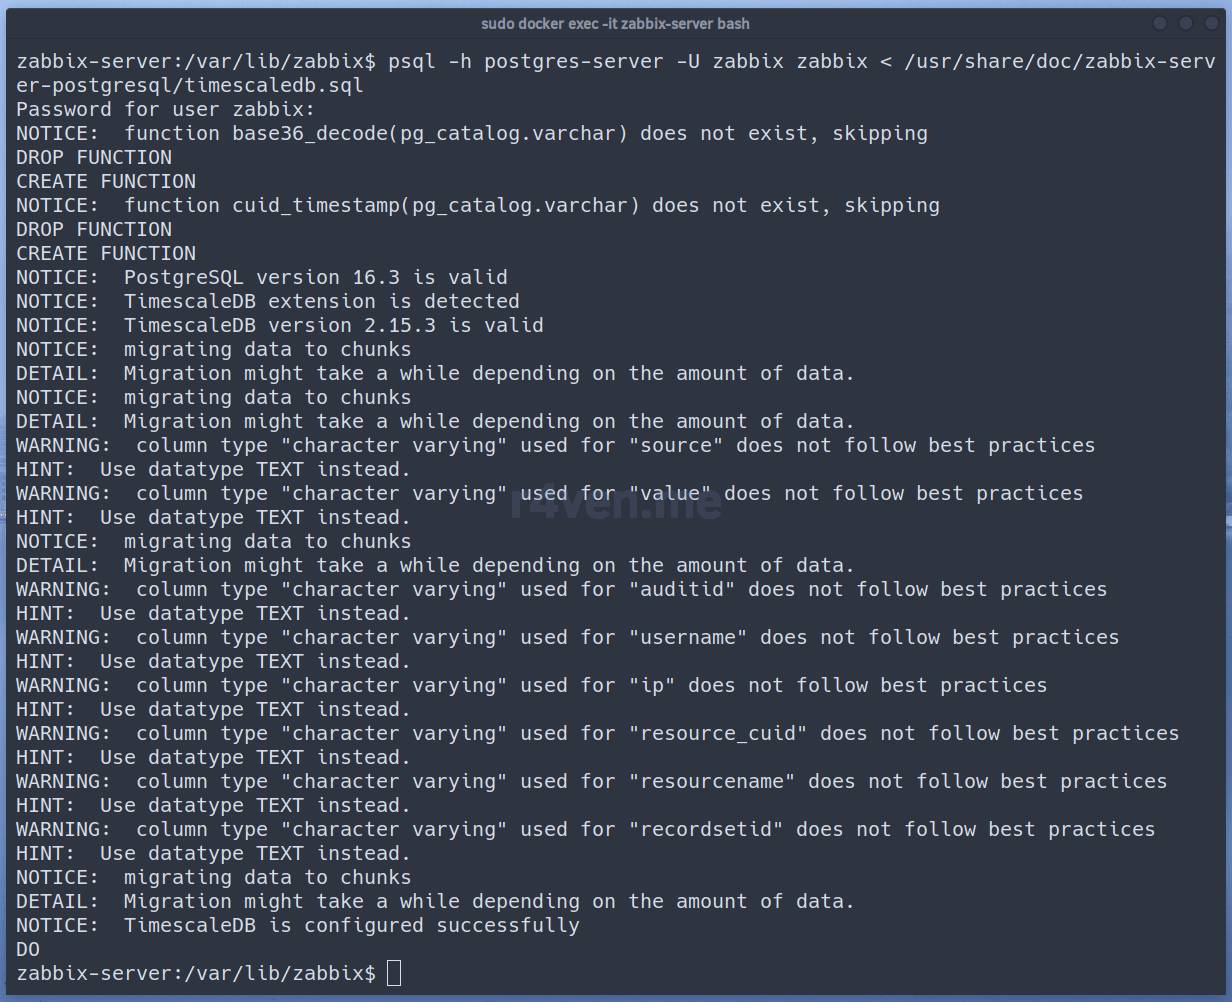
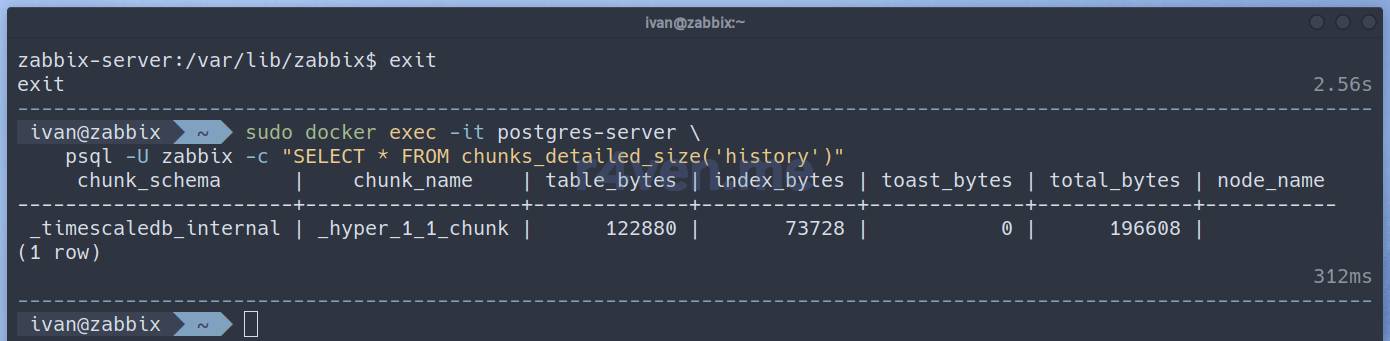
Now let’s import the TimescaleDB schema using an SQL script that the Zabbix developers kindly included in the system files. When entering the import command, we’ll be asked for the DB password, which we printed in the previous step:
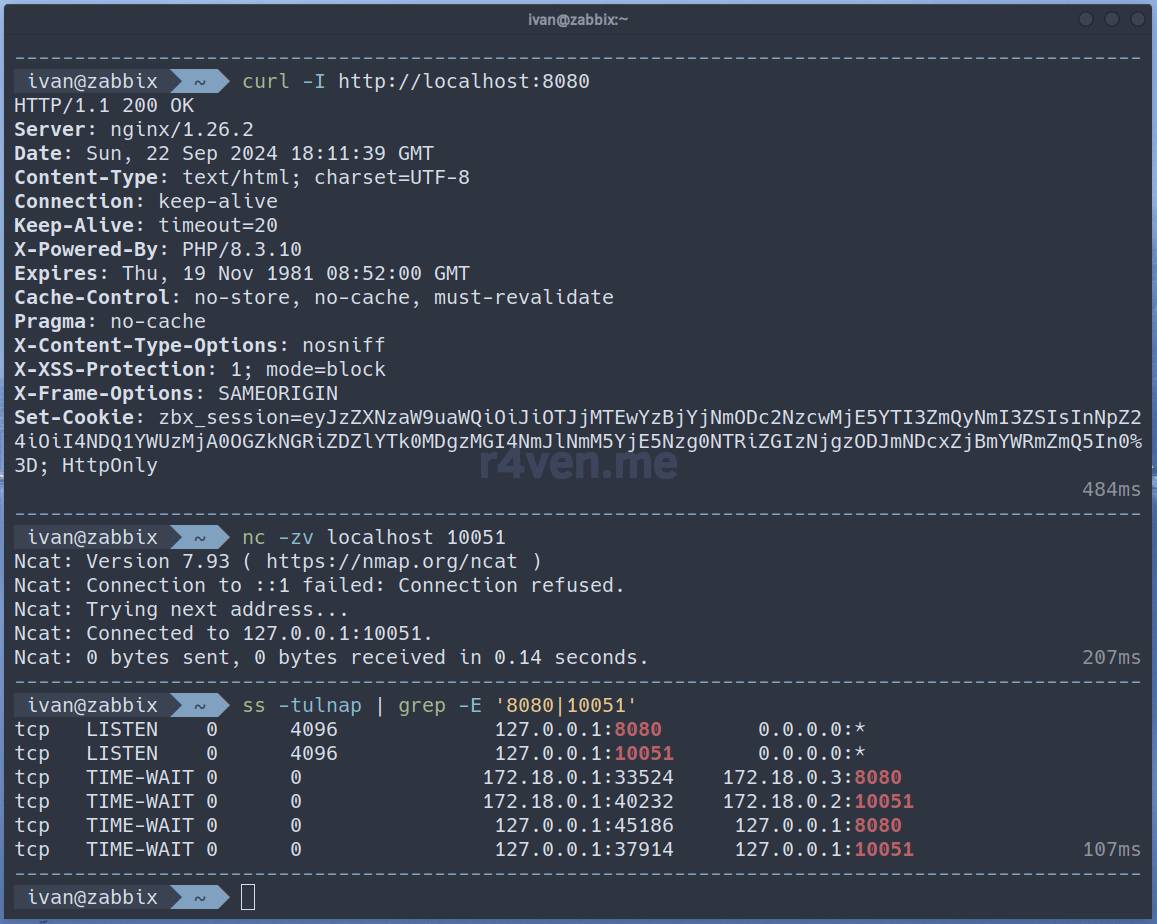
With the first command we checked the availability of the web interface from the console, with the second — the availability of the zabbix-server port, and with the third we printed the ports being listened on by the host OS.
Great, everything works 🎉🎉🎉.
Access to the Zabbix web interface
The way to get access to the Zabbix web interface depends on the conditions in which you deployed the stack. I’ll describe a few obvious options.
Click on the spoiler to view the instructions
If the Zabbix server is deployed on the local machine
Just type the URL in your browser 😁😁😁:
BASH
http://127.0.0.1:8080/
Click to expand and view more
If the Zabbix server is deployed on a remote server that is on a local or VPN network
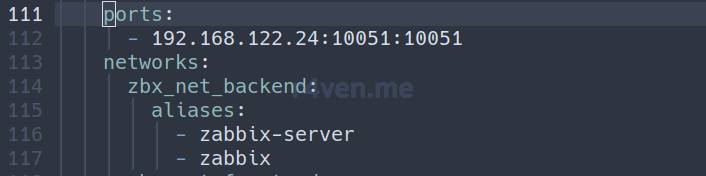
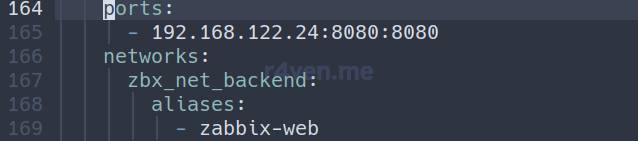
In this case, edit the network settings for the zabbix-server and zabbix-web services in the docker-compose.yml file.
For example, my server’s internal address on the VPN network is: 192.168.122.24. Let’s edit docker-compose.yml:
BASH
sudo vim /opt/zabbix/docker-compose.yml
Click to expand and view more
zabbix-server:
zabbix-web:
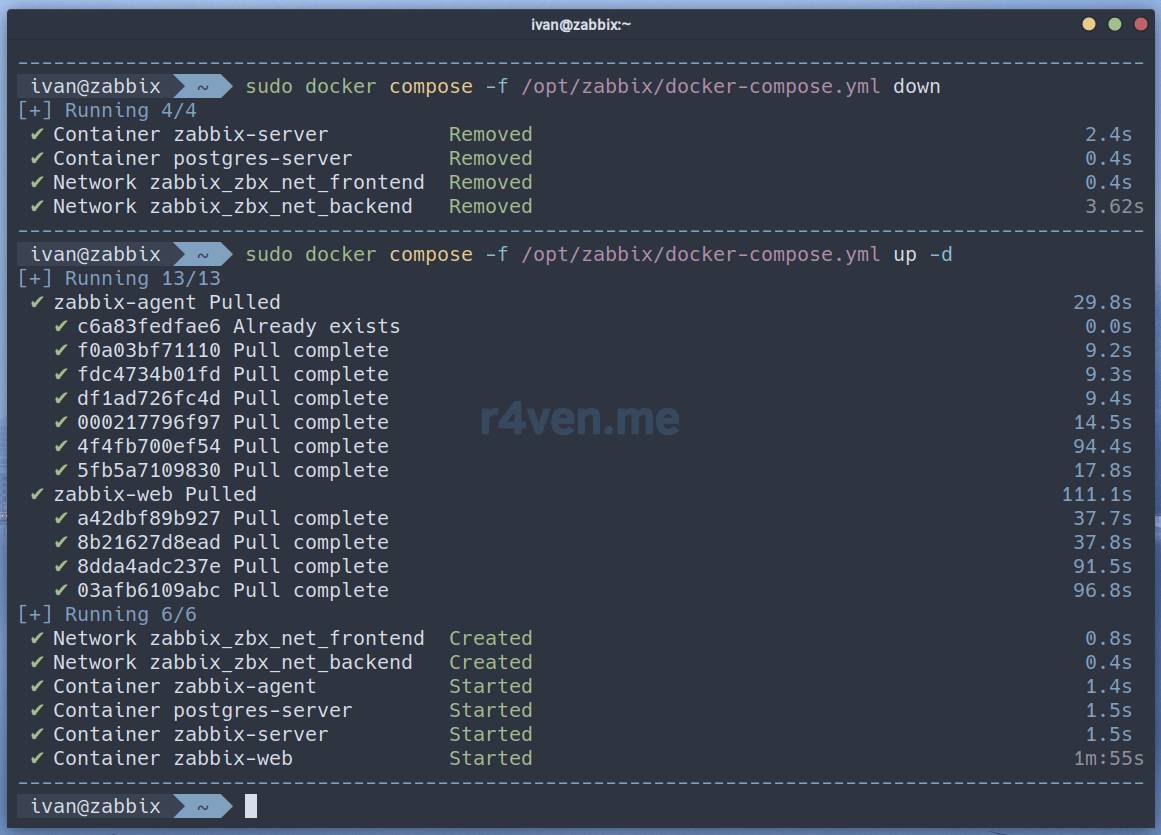
Let’s restart all containers:
BASH
sudo docker compose -f /opt/zabbix/docker-compose.yml down

sudo docker compose -f /opt/zabbix/docker-compose.yml up -d
sudo docker ps
Click to expand and view more
On a client connected to the VPN network, I open the following URL in the browser:
BASH
http://192.168.122.24:8080/
Click to expand and view more
If the Zabbix server is deployed on a remote server and is not connected to a local or VPN network
In this case you can forward an SSH port or open direct access, or access via a reverse proxy such as nginx. I’ll only cover the first case, as the simplest. Also because the other two are beyond the scope of this article 😜.
On the client, open a terminal and run:
BASH
ssh -L 8080:127.0.0.1:8080 user@example.com
Click to expand and view more
Where (in order):
-L — the local port forwarding flag;
8080 — the port that the client machine will listen on and forward to the server’s port 8080;
127.0.0.1 — the address of the server on which it listens on the port;
8080 — accordingly, the port we’re forwarding to;
user@example.com — the user and address of the SSH server.
In my example the command is:
Now open a browser and go to: http://127.0.0.1:8080/
Access to the web interface will be available while the SSH session is open.
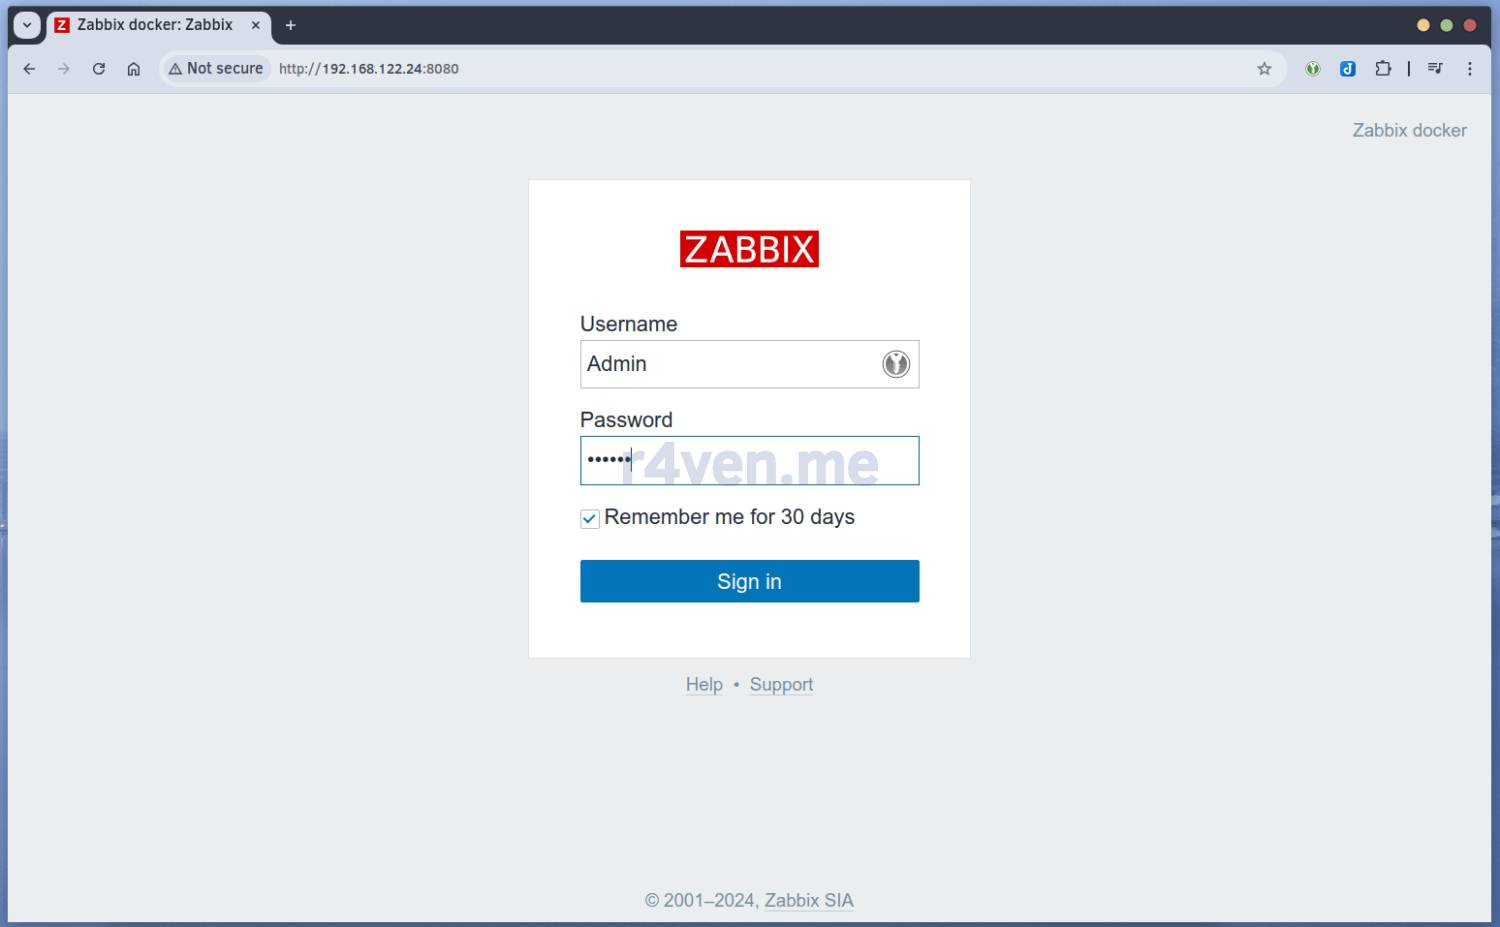
To log in to the web interface, use the standard login: Admin and password: zabbix
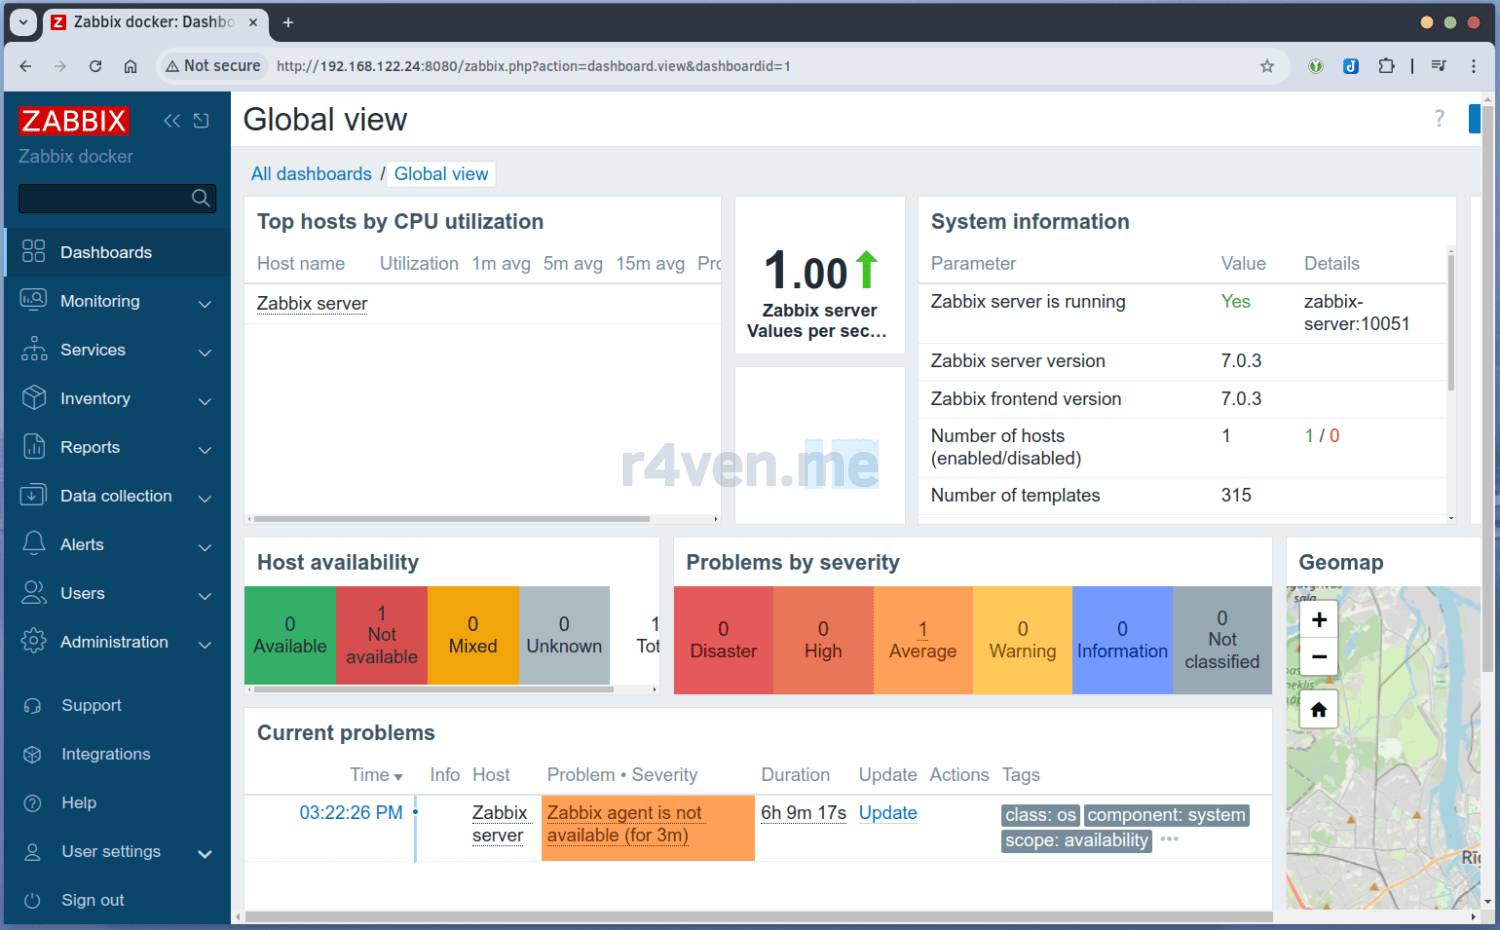
If you saw this:
My congratulations 😎! The Zabbix server with TimescaleDB is up and ready to work 👷♂️.
Optional
Below are optional but recommended steps of the guide 😉.
Minimal initial setup of the Zabbix server
Click on the spoiler
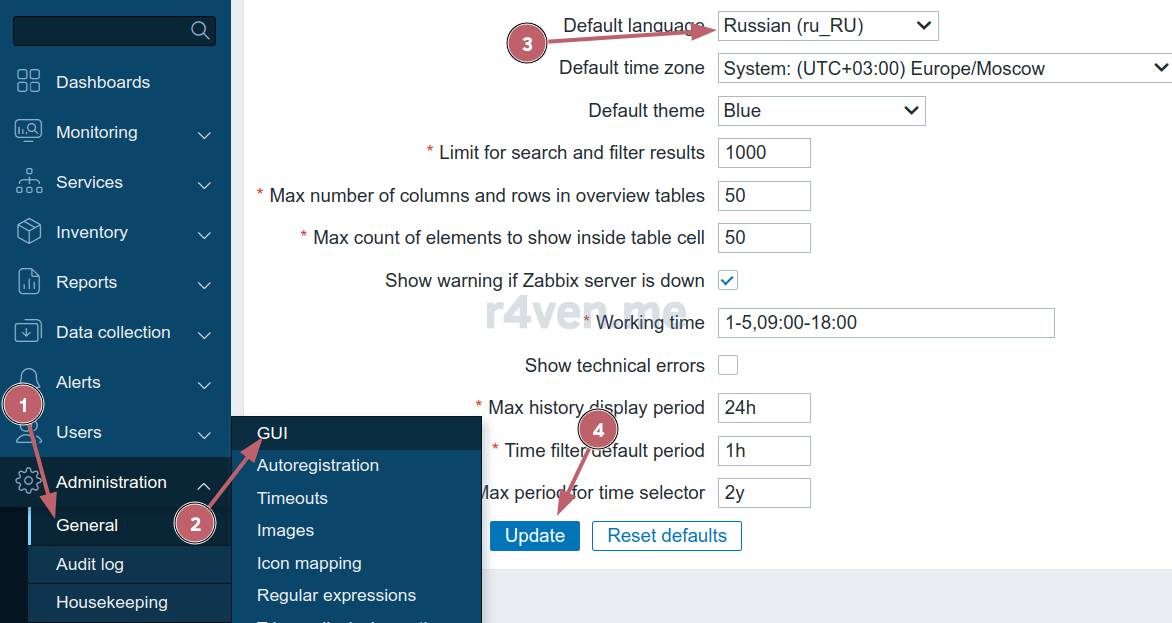
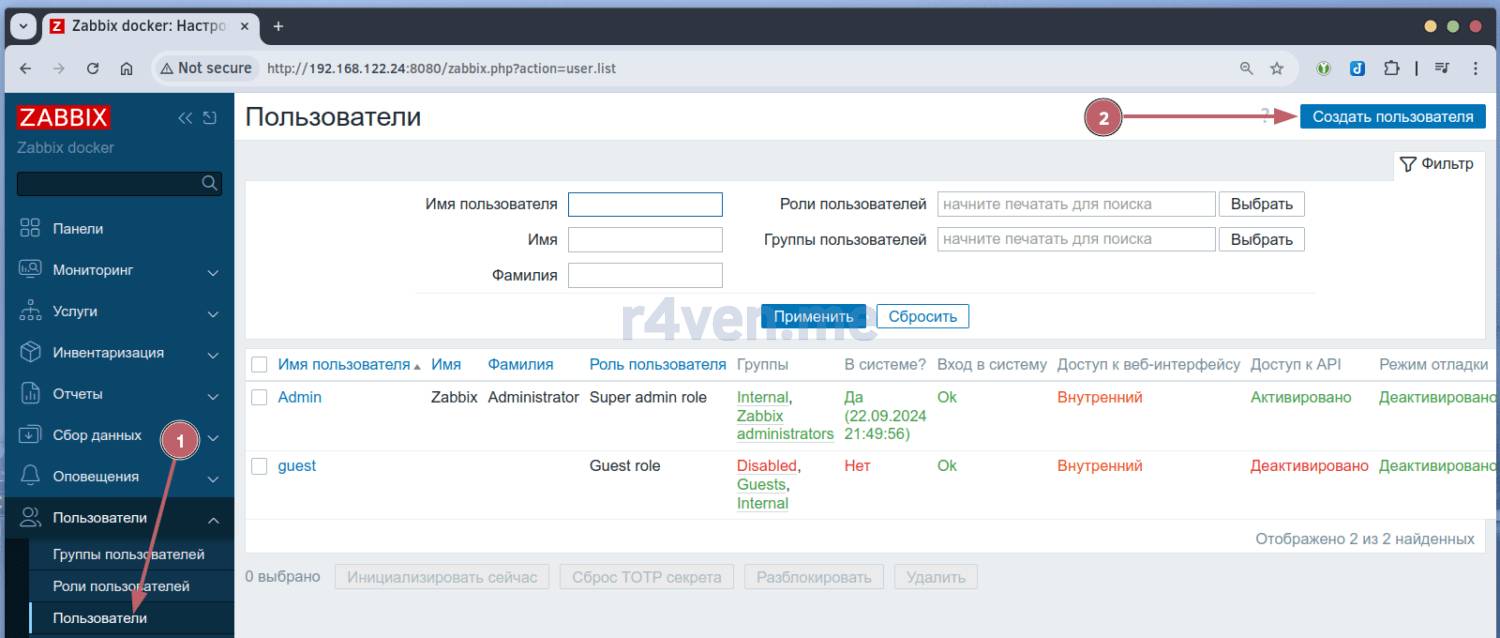
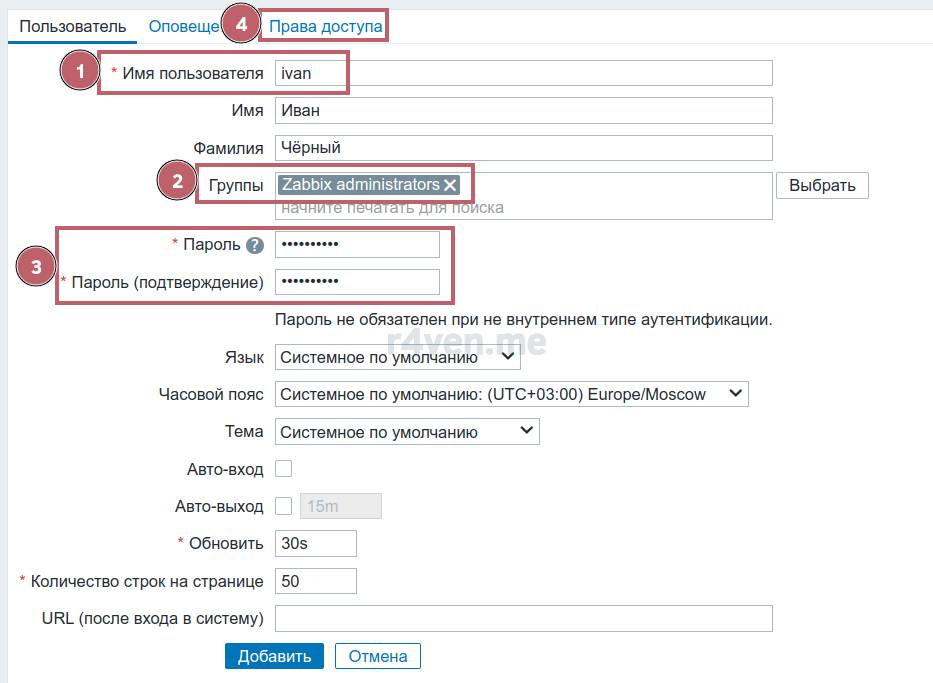
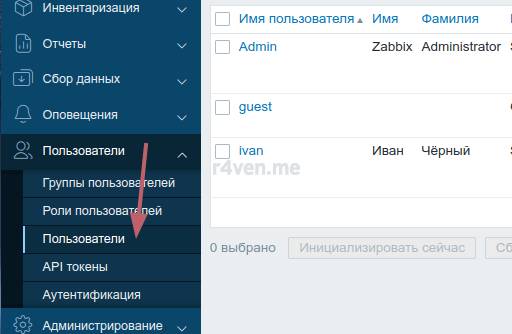
I won’t go into much detail on Zabbix configuration, since that’s a topic for more than one article 🤯. I’ll just show how to change the interface language, create a new user with admin rights, disable the default Admin, and configure a local Zabbix agent to monitor the Zabbix server itself.
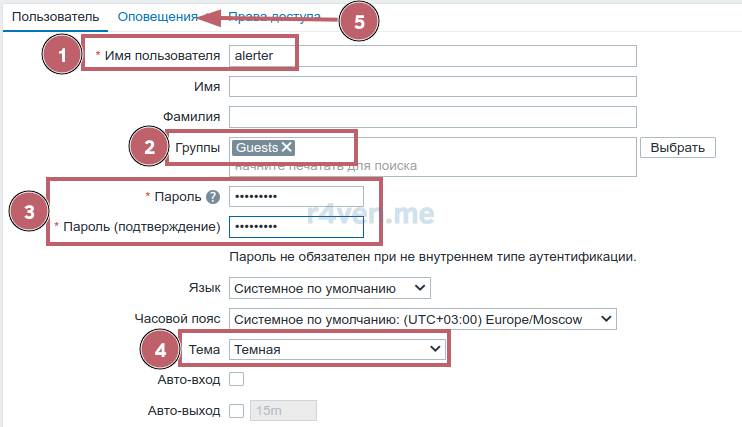
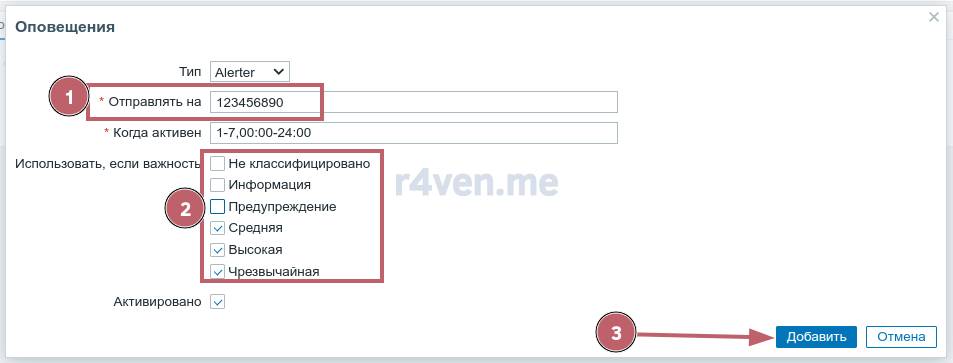
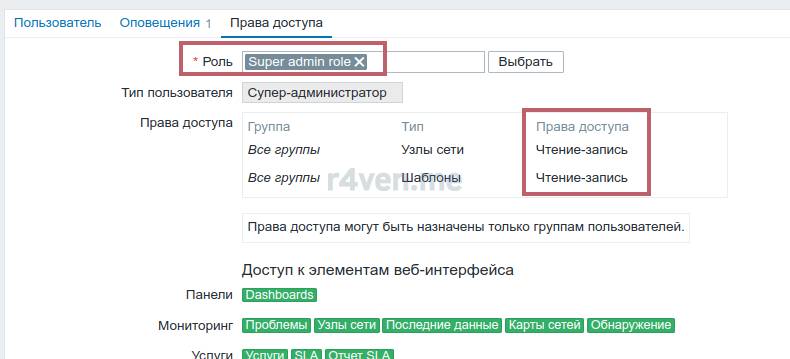
All the steps are shown in images and don’t really need comments 😏.
Changing the language
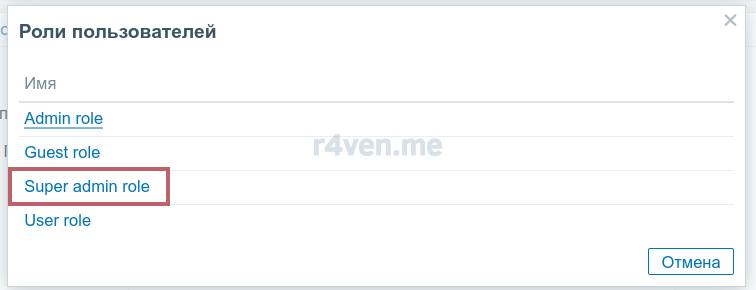
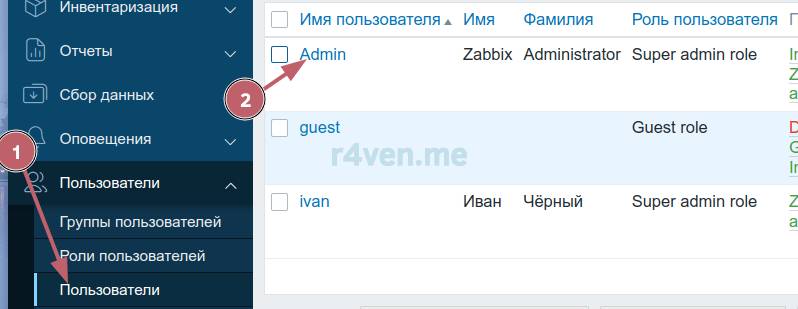
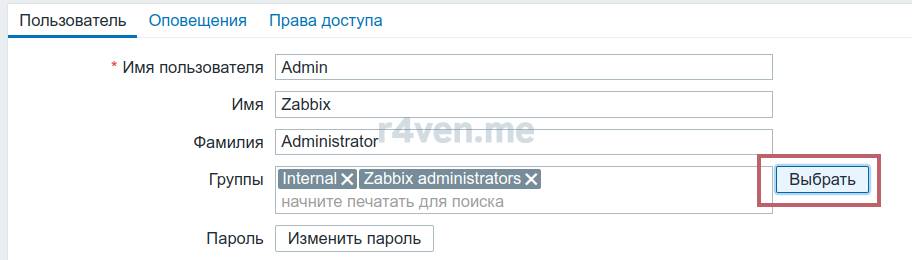
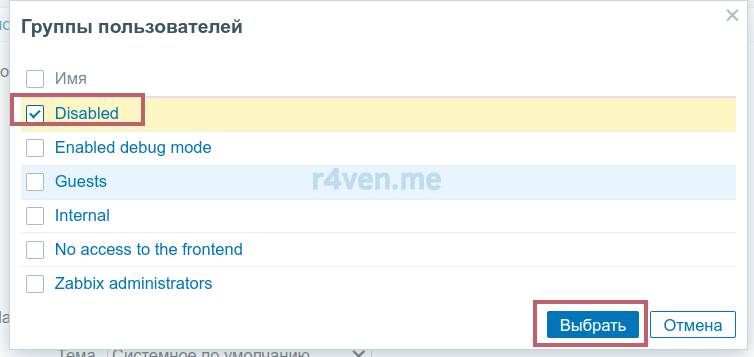
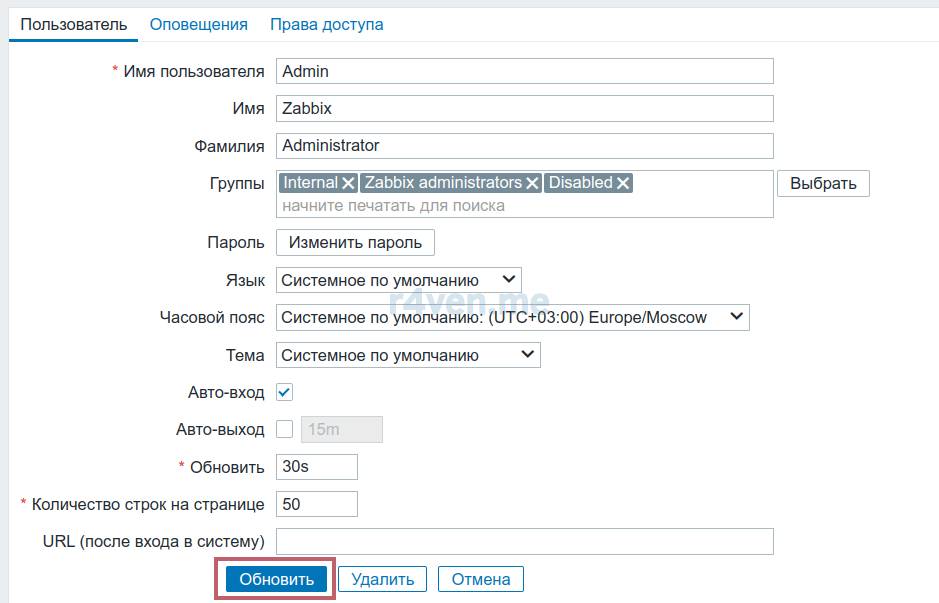
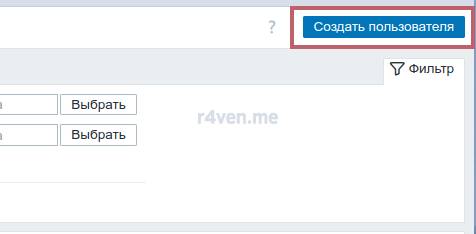
Creating a new user
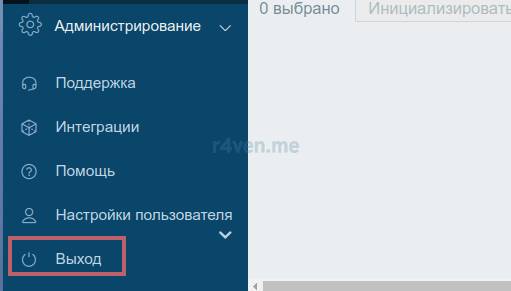
And log back into the interface as the new user:
Disabling the default Admin user
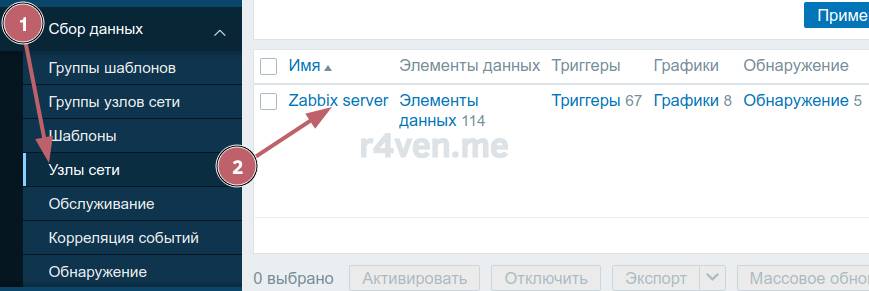
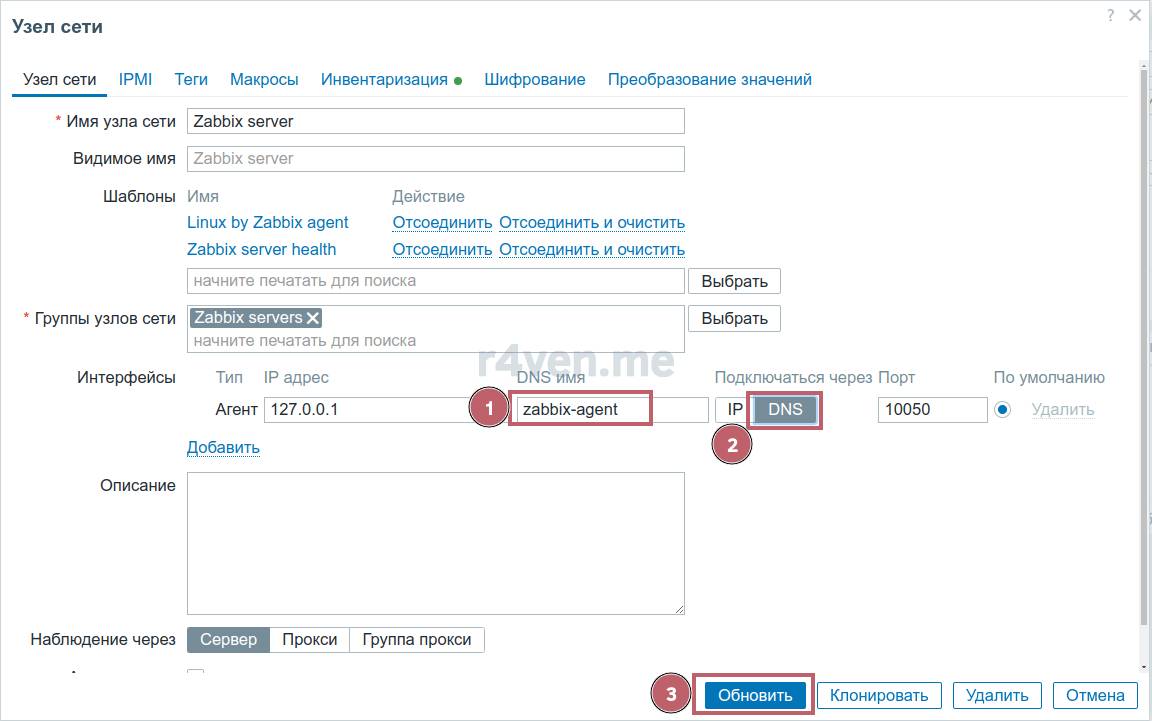
Connecting the local Zabbix agent
This agent was set up by us at the moment we launched the whole installation and is available under the domain name zabbix-agent inside the container network.
Here, make sure to select “Connect to” — DNS:
Now go to the “Monitoring” — “Problems” page. After a few minutes, the issue with the local zabbix-agent availability should resolve:
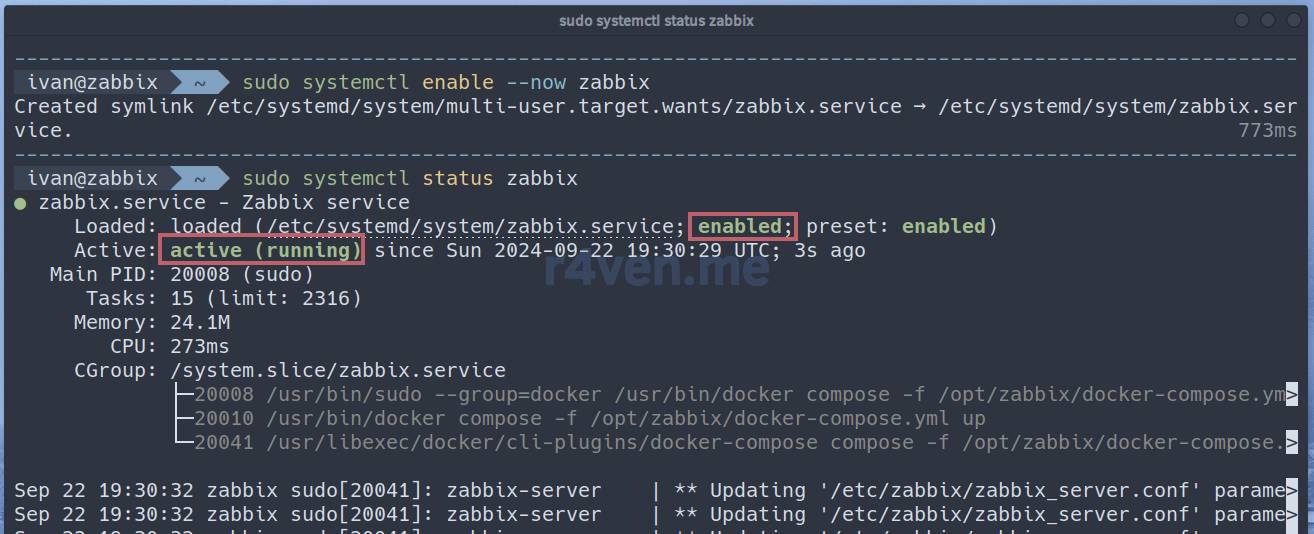
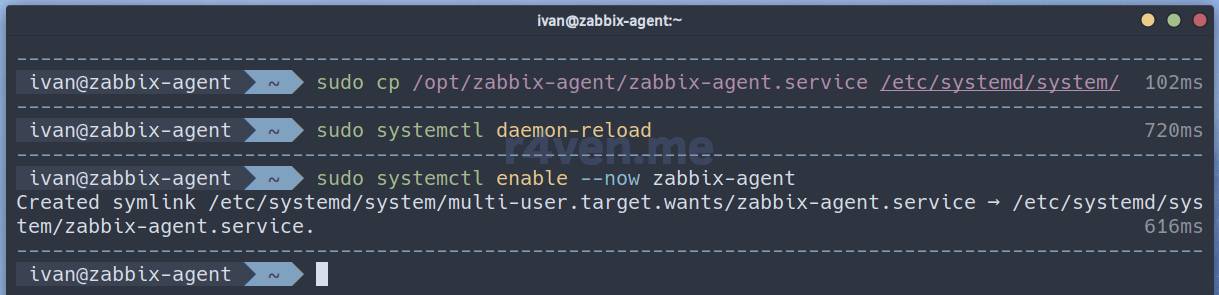
Configuring autostart of the Zabbix stack with systemd
Click on the spoiler
At the beginning of the article we created a zabbix service user. Let’s use it to safely run the Zabbix stack services.
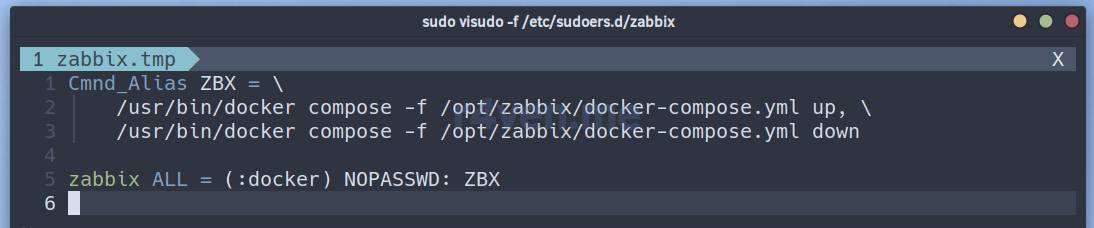
Configuring sudoers to run Zabbix as the service user
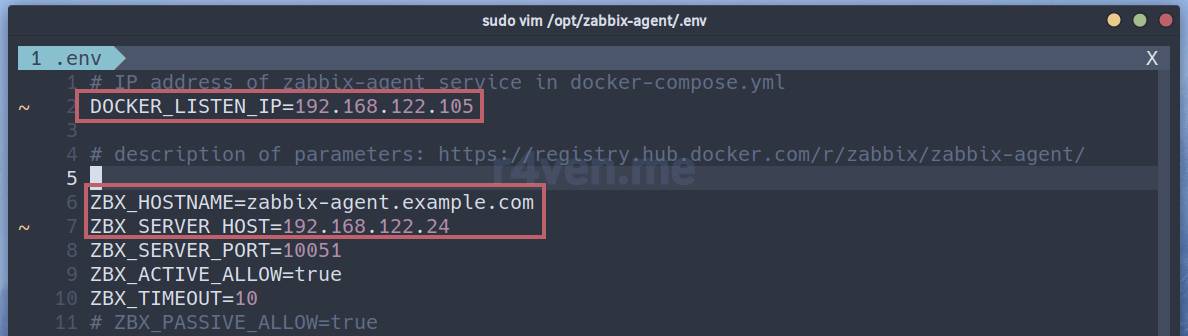
Let’s edit the .env file — the file with the Zabbix agent’s parameters.
BASH
sudo vim /opt/zabbix-agent/.env
Click to expand and view more
Here you must set the existing IP address of the host on which the Zabbix agent service will wait for connections. Also specify the agent’s hostname and the Zabbix server’s address.
A nuance. If you have many external partitions mounted on your server, you need to add them to the volume block in docker-compose.yml, so the Zabbix agent detects them.
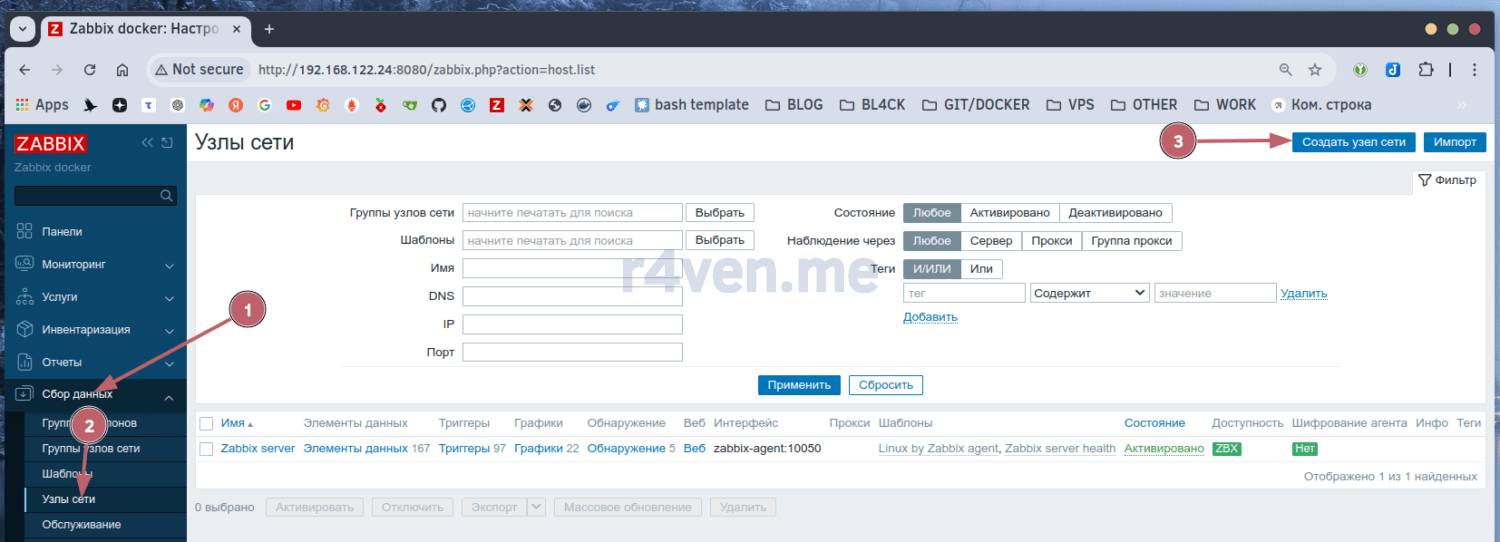
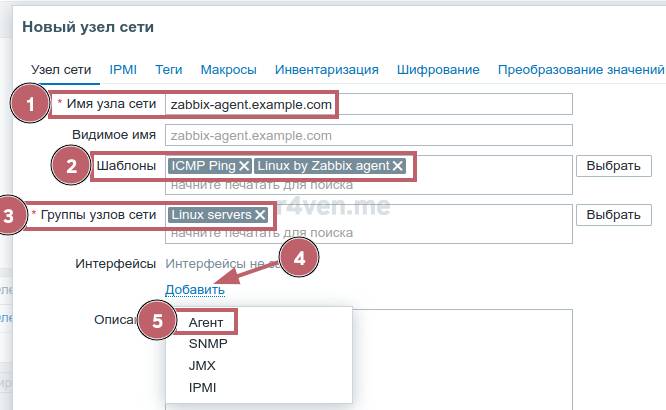
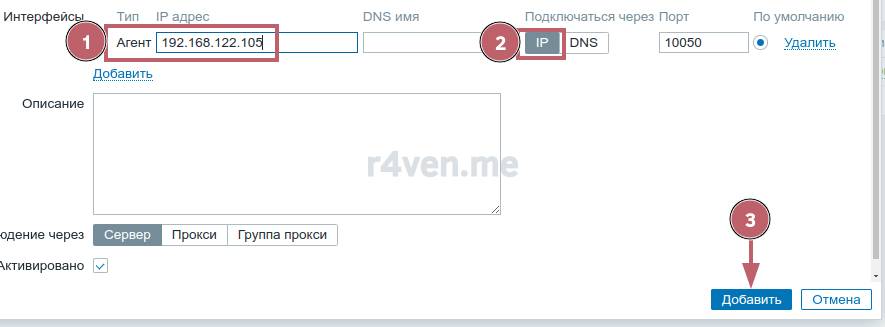
Adding the Zabbix agent to the Zabbix server
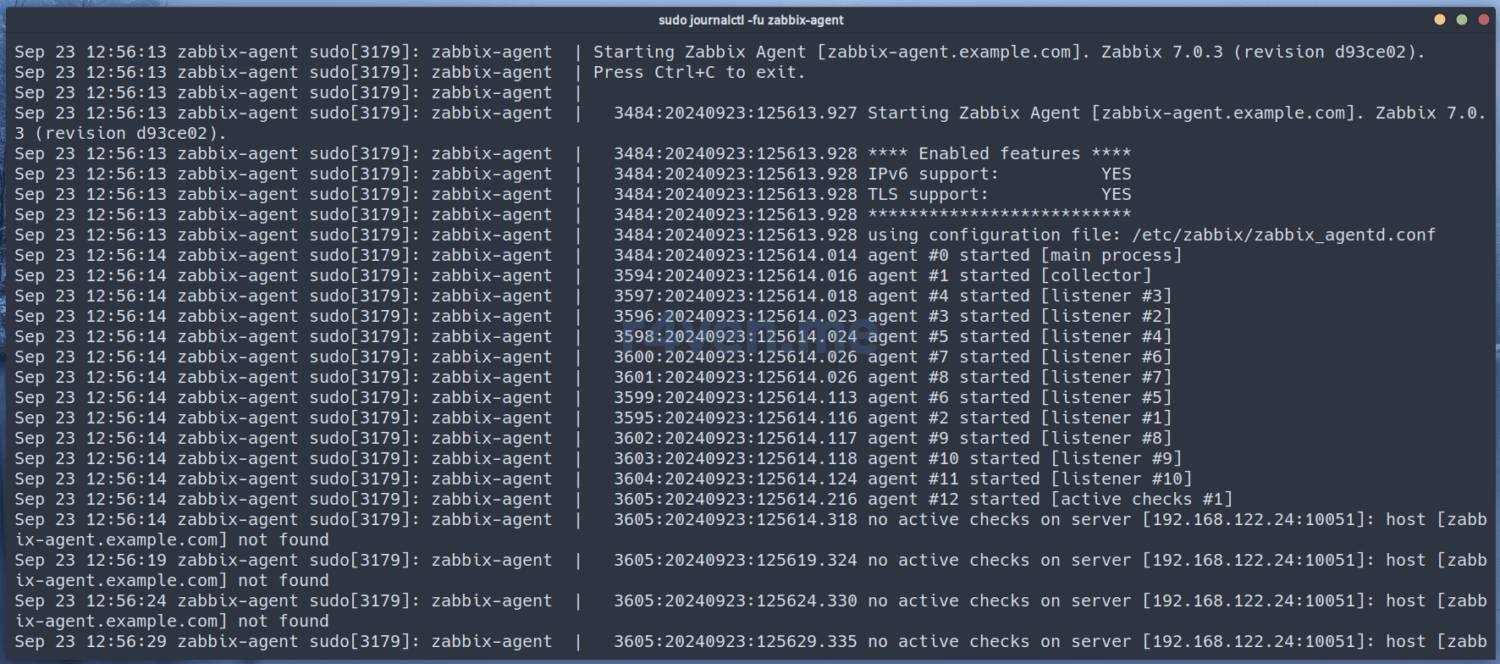
Here it’s almost all in images 😇.
Go to “Monitoring” — “Hosts” and after some time:
Hooray! 🥳🥳🥳
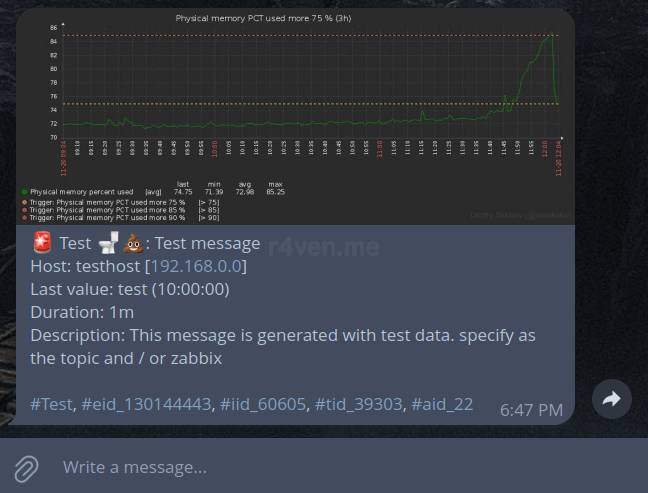
Setting up sending Zabbix notifications to Telegram with a graph
Click on the spoiler
And now for something interesting 🧐. To implement the ability to send alert notifications to Telegram with graphs, I rebuilt the zabbix-server container, adding a Python interpreter, a special venv, and files from the GitHub repository of developer xxsokolov — this method is marked on the official Zabbix website as valid 👌.
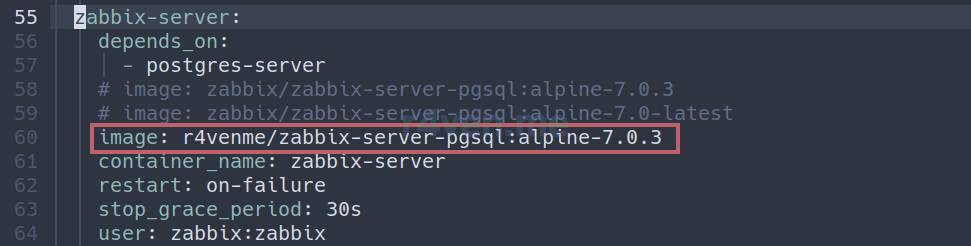
In the instructions below, the option of using my image is covered: r4venme/zabbix-server-pgsql:alpine-7.0.3, but you can also build your own. You’ll find all the build files in the repository downloaded at the start of the article, in the src folder.
Let’s start the configuration.
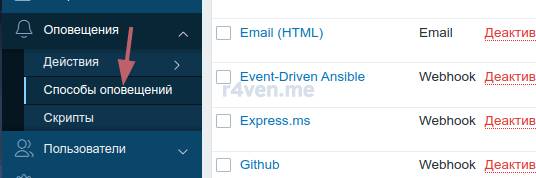
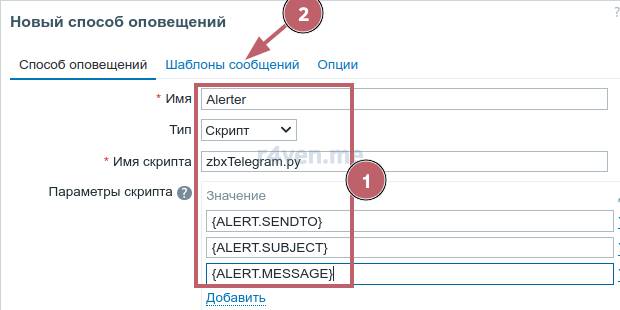
Creating the alert type (web interface)
Name (arbitrary): Alerter
Type: Script
Script name: zbxTelegram.py
Script parameters:
{ALERT.SENDTO}
{ALERT.SUBJECT}
{ALERT.MESSAGE}
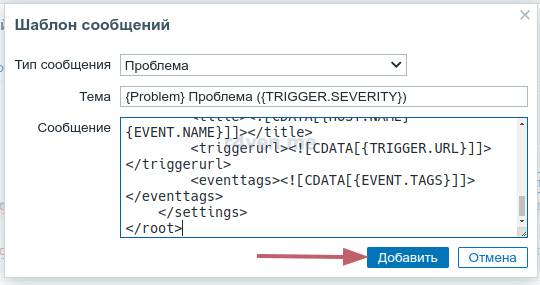
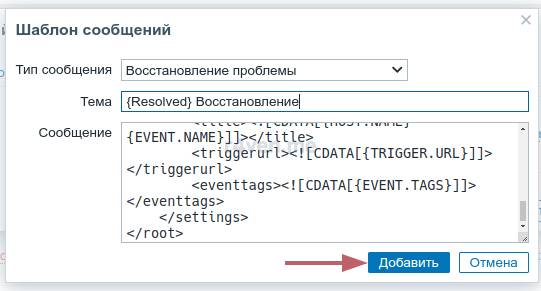
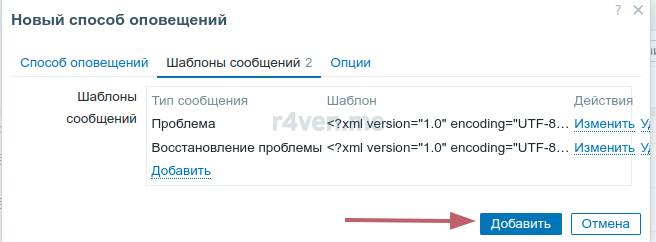
Next, go to the templates tab and add 2: for problems and for recovery:
Next, go to “Permissions”. Ideally, here you should first set up restricted user groups and roles. But this is a delicate process, and it’s also beyond the scope of the article. As a quick solution, I grant the service user “super admin” rights, since the script needs read permissions for hosts and templates. It’s up to you.
And at the end, click the main “Add”:
Configuring alert conditions (web interface)
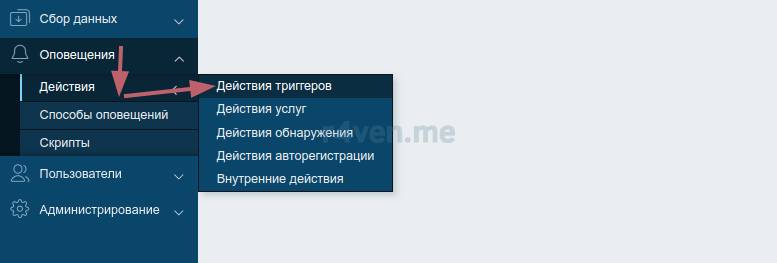
Go to “Trigger actions” and create a new one:
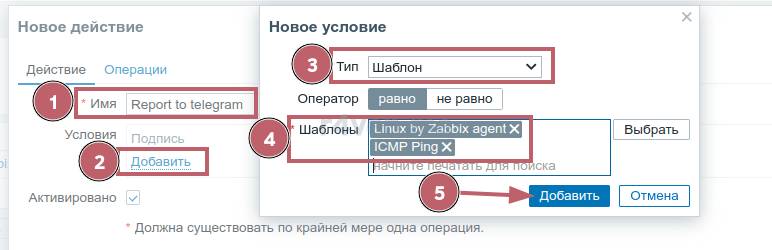
Set a name and add a condition. In the condition, specify 2 templates, as in the screenshot:
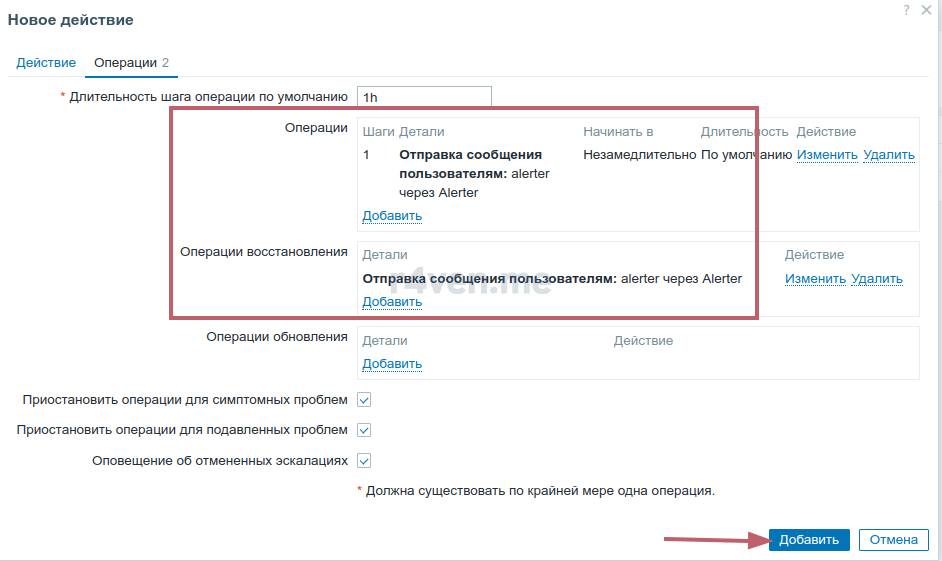
Next, go to the “Operations” tab and there add 2 actions: for “Operations” and “Recovery operations”:
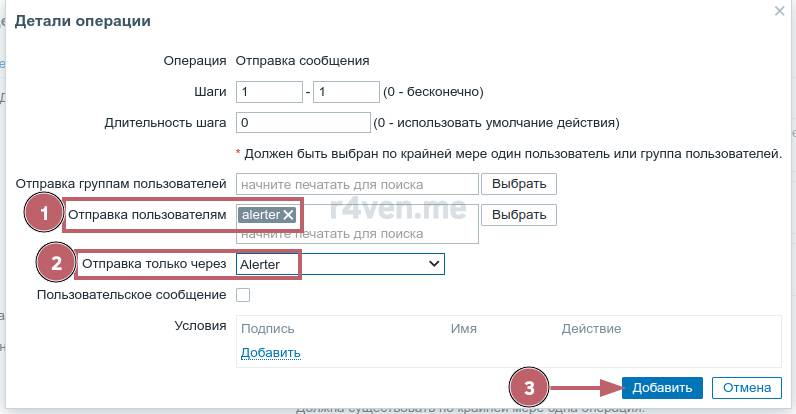
Specify the recipient — our service user, for whom we set the group/chat ID in Telegram. Here we also specify the sending method: the one we created earlier:
Roughly like this:
Editing docker-compose.yml (server console)
Let’s go back to the server and open for editing:
BASH
sudo vim /opt/zabbix/docker-compose.yml
Click to expand and view more
Let’s edit the zabbix-server service, the image block. Comment out the current line, and uncomment the line with the address of the image I built:
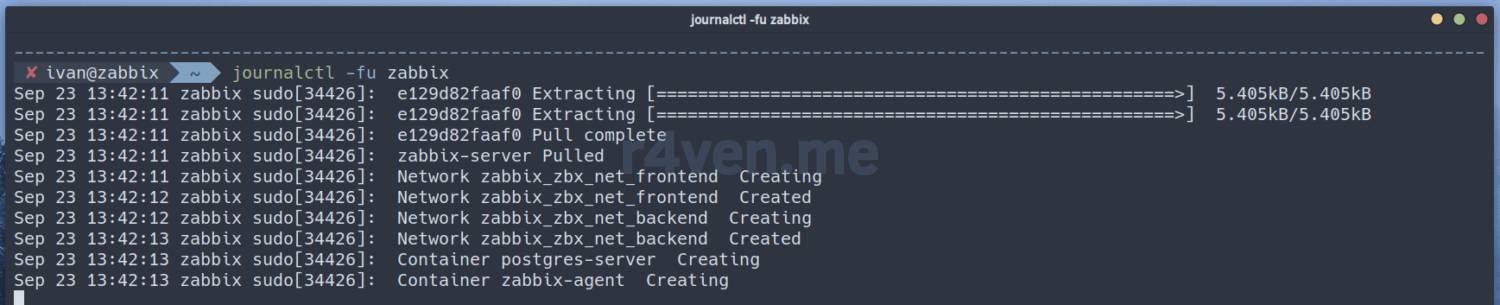
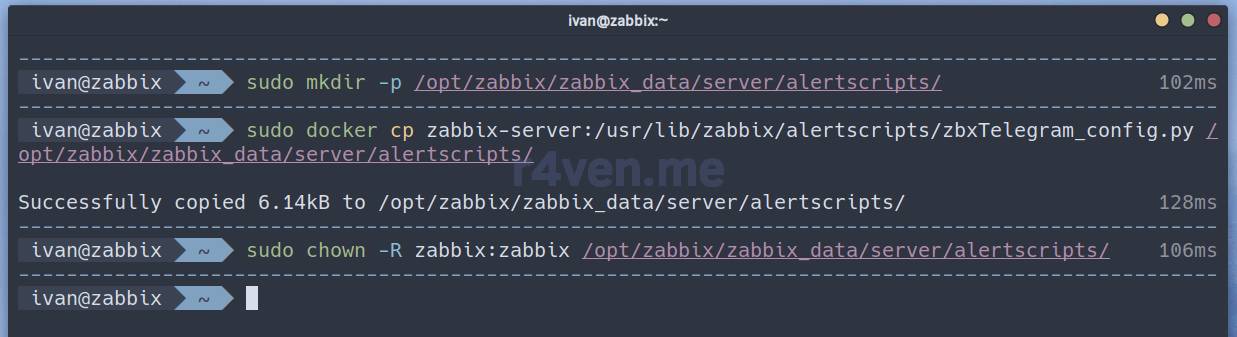
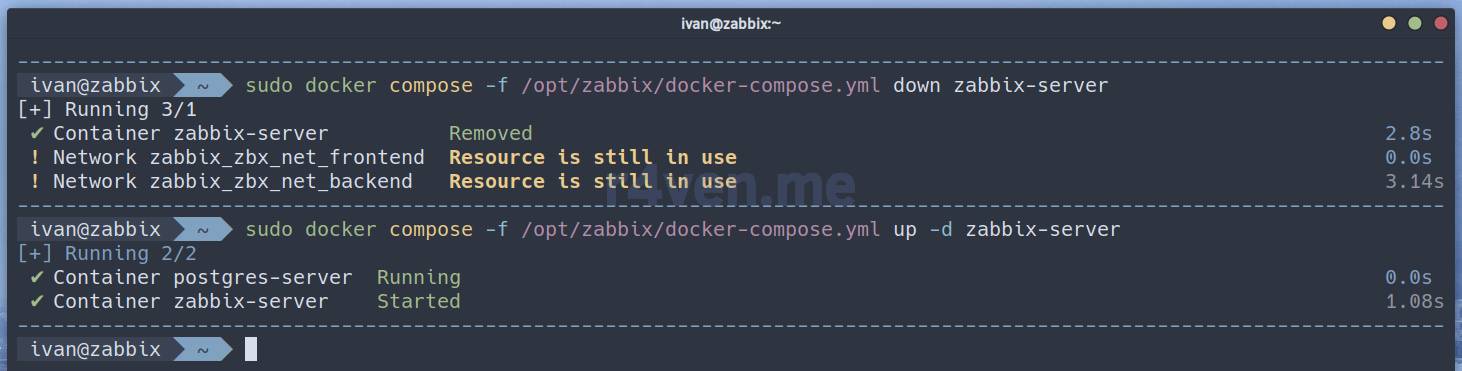
After starting, create the alert scripts folder, copy the config file for the Telegram notification script from the zabbix-server docker container into it, and change its owner:
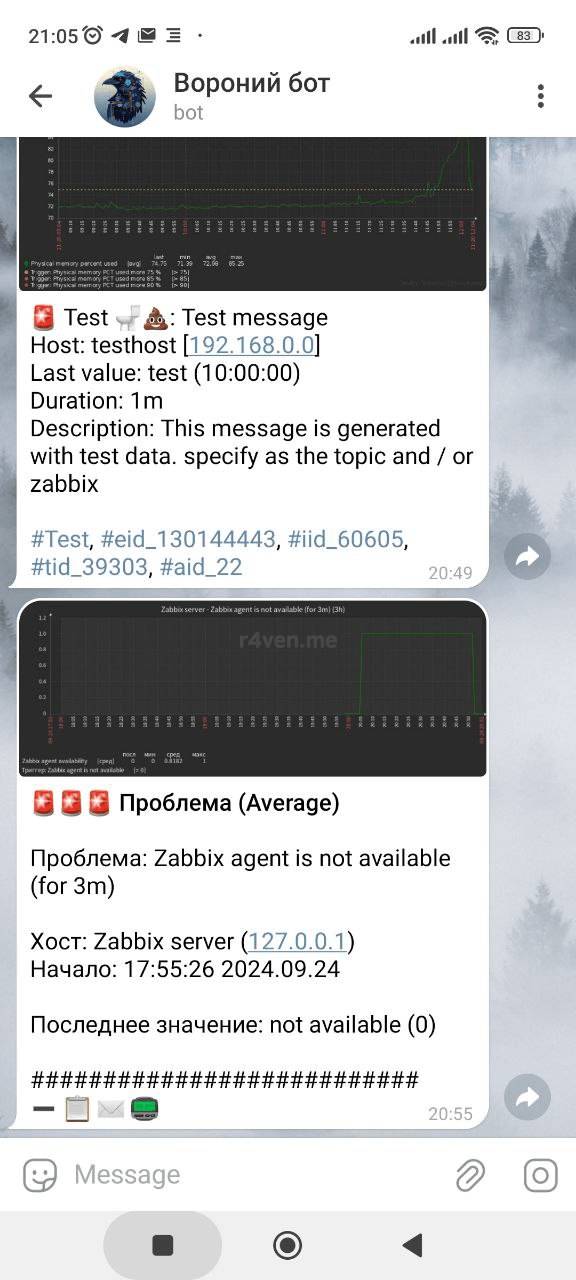
Go to the web interface: “Monitoring” — “Problems”. After a few minutes, the agent will get the “Unavailable” status, a problem will appear on the corresponding web panel, and you should get a notification in Telegram.
The message arrived, great. Now let’s start the agent:
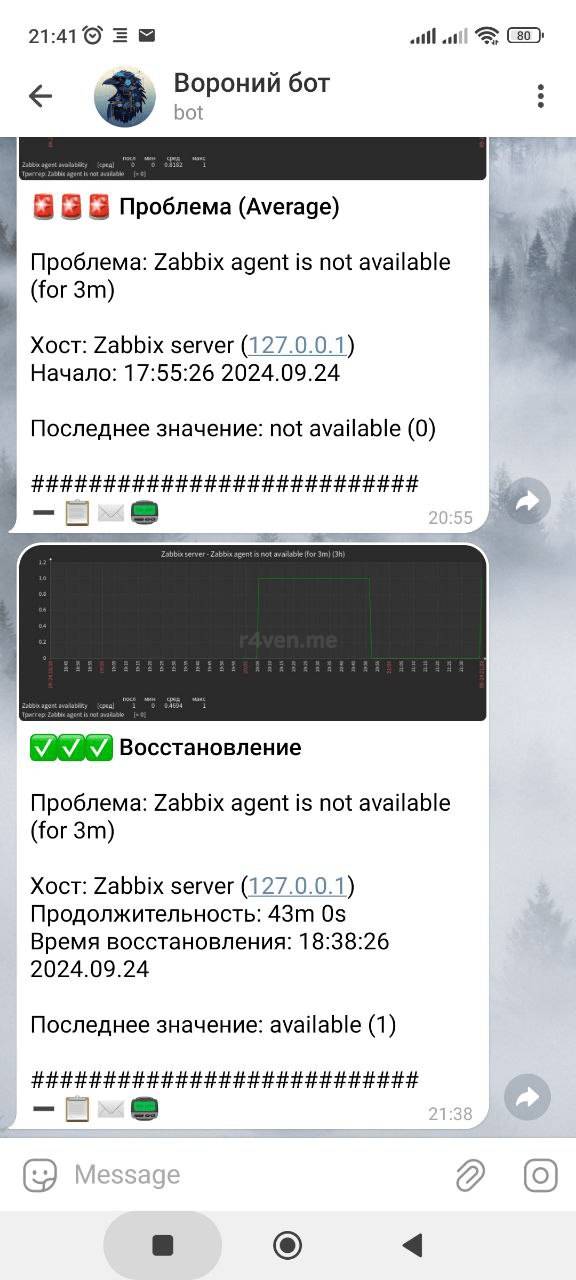
After a few minutes it will recover in the web panel and a corresponding notification will arrive in Telegram:
Lovely 🤤.
Conclusion
Phew..🤯 that was not the simplest article. Especially in terms of the amount of information processed. But, I think it was worth it. In the end we got a flexible and easily portable monitoring system project running inside docker containers. We also set up concise but informative notifications with graphs in Telegram, to always stay aware of the state of our infrastructure.
I’d also like to note the excellent work of the Zabbix developers. In particular, the relevance and variety of docker images and the availability of their build files. After writing this article, I respect them even more 👍.
Thanks for reading 😊. If you have questions — I invite you to the Raven chat, as you guessed, on Telegram 😅. We have a friendly community there 🚶♀️🐧🚶🐧🚶♂️🐧. And be sure to subscribe to the main Telegram channel: @r4ven_me, so you don’t miss new publications on the site.
Could you recommend some useful articles on Zabbix? Deploying it is half the job, if not less, but what to do with it after that… The system is quite complex, and it’s hard to figure out without a bit of vodka… Something explaining the philosophy, architecture of the system, and recommendations for building your own monitoring system…
Ivan Cherniy:
Good day. Agreed, the system is not the simplest. I recommend starting your study with the official documentation, which, by the way, is well translated into Russian: https://www.zabbix.com/documentation/6.0/ru/manual (in this case the documentation is for Zabbix version 6, but the difference isn’t huge here). I especially want to draw attention to the definitions page: https://www.zabbix.com/documentation/6.0/ru/manual/definitions — from experience I can say that the most important thing is to get a clear picture of the Zabbix entities that this monitoring system operates with in its work.
For getting a general idea — this is more than enough. Then look for configuration examples for the specific tasks you’re interested in. Here are a few examples that I’ve recently worked on:
Probably nothing new for you here, but the whole difficulty is that this could be talked about for a very long time. In this case I stick to the “specific to general” principle. I.e., a task comes up to set up monitoring for some service or event — I find a suitable article and try to configure it similarly.
📝 Note
Konstantin Knyazev:
Good time of day! Tell me, have you built an image of the latest version of OpenConnect for the arm64 architecture? I’m having difficulties with this and have been struggling with it for quite a while already
Ivan Cherniy:
Good day. There hasn’t been such a need. Maybe I’ll look into it.
📝 Note
Anton:
Good day. Could you tell me, if PostgreSQL is already installed on the server? But the version for 1C, so the postgres user is already created, but with a different uid and gid — will the DB server in the container work correctly, and will it harm the DB already running directly on the server?
Ivan Cherniy:
Good day. It’s advisable to test such manipulations in a test environment first.
Docker by default relies on the user’s uid:gid. That is, if on the host system the postgres user has uid:gid = 1001:1001, and in the container 70:70, then the owner of the postgres container’s files will be the numeric identifiers 70:70, or whichever user has these identifiers.
In your case, you can give the service user for the postgres container a different name, for example postgres-docker, and set identifiers uid:gid = 70:70 (if they’re not taken). In that case you’ll have to adjust the user parameter for the postgres service in docker-compose.yml, setting the value to just the numbers 70:70.
And also edit the corresponding systemd unit file and the sudoers file, changing the name to postgres-docker.
If you still decide to experiment in the production environment, be sure to make a backup of the 1C database before making any significant changes to the system.
Anton:
Thank you very much for such a detailed answer.
Anton:
Good day, after starting the DB server container, the logs say: “initdb: error: could not change permissions of directory “/var/lib/postgresql/data”: Operation not permitted fixing permissions on existing directory /var/lib/postgresql/data … chmod: /var/lib/postgresql/data: Operation not permitted The files belonging to this database system will be owned by user “postgres”. This user must also own the server process.” I tried creating the directory manually and changing the owner to 70:70, same result.
Ivan Cherniy:
Good day. I’ll guess that the problem is the uid gid inside the container. Explicitly specifying the container’s environment variables PUID and PGID in the compose file might help.
I’ll try to find time to run tests on my end.
Anton:
Sorry, it turns out the postgres user’s home folder just wasn’t created. After creating it manually, and starting the container as the user with uid and gid 70:70, everything worked perfectly. Thank you very much for the material and advice!


































Comments