

In this note we’ll talk about what types of monitoring systems exist, and as usual, we’ll look at their most popular implementations today. This is an important topic, so don’t be lazy and read it — it won’t take much time 😉.
🖐️Hey!
Subscribe to our Telegram channel @r4ven_me📱, so you don’t miss new posts on the website 😉. If you have questions or just want to chat about the topic, feel free to join the Raven chat at @r4ven_me_chat🧐.
I’d like to note that this theoretical post📕 precedes a future article on deploying Zabbix + TimescaleDB in Docker containers 🐳.
In the article I’ll use the abbreviation MS — short for monitoring system.
Instead of an introduction: why are monitoring systems needed?
TLDR: so you don’t end up doing this 😁

But seriously, below is a list of tasks that MS📊 solve:
- Metrics collection: collecting performance data of infrastructure elements, such as CPU, RAM, DISK usage and many others;
- Fault detection: timely identification of problems allows administrators and developers to fix them faster;
- Sending notifications: almost every monitoring system has notification-sending functionality via various communication channels (email, messengers, SMS, etc.) in case a problem is detected;
- Advanced analytics: MS collects and stores a lot of data, the analysis of which helps identify bottlenecks and improve system performance;
- Reducing downtime: obviously, monitoring allows you to detect service degradation in advance and prevent serious failures.
Types of Monitoring Systems
Now a bit about the main types of monitoring systems that exist📋:
- Infrastructure monitoring — tracks the state of servers, network devices, databases, and other IT infrastructure components. Examples of MS: Nagios, Zabbix.
- Application monitoring — monitors the state of applications and their performance at the code level, identifying bottlenecks and software issues. Examples of MS: New Relic, AppDynamics.
- Log monitoring — analyzes application and system logs to detect errors, failures, and anomalous actions. Examples of MS: Elasticsearch, Logstash, Kibana (ELK Stack).
- Network traffic monitoring — designed to track network activity, analyze bandwidth, and find anomalies in network traffic. Examples: SolarWinds, Wireshark.
- Cloud monitoring — tools specifically designed for monitoring cloud resources and their infrastructure. Examples of MS: Amazon CloudWatch, Google Cloud Monitoring.
Popular Monitoring Systems
Now let’s look at some popular open source solutions in the MS category, and briefly go over their advantages and disadvantages.
1. Zabbix
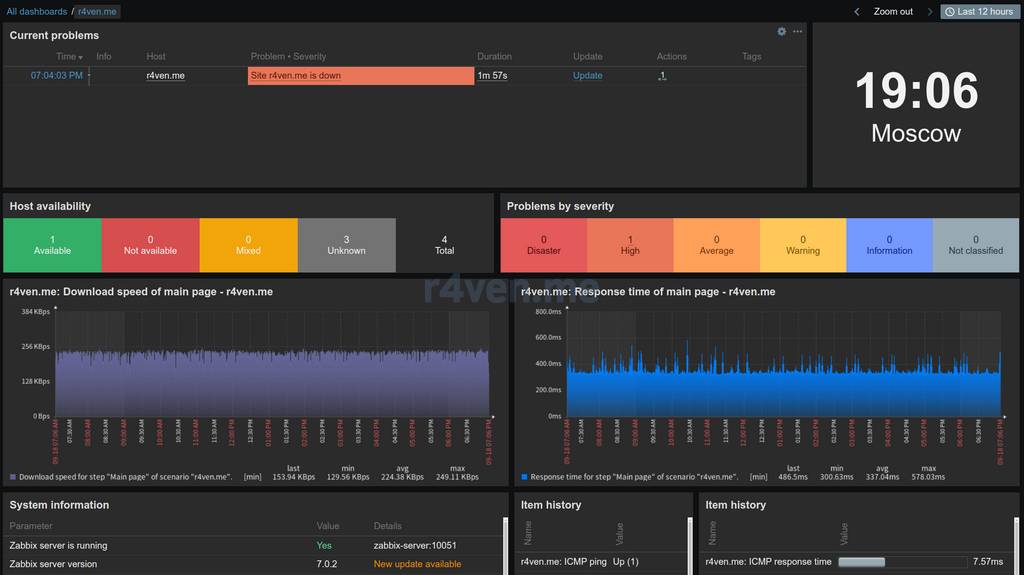
Zabbix is an open platform for monitoring networks and servers. It supports collecting data from various sources and provides detailed graphs and reports.
Pros:
- Free and open source.
- Flexible configuration for any needs (basically an all-in-one solution in the world of MS).
- Support for a large number of metrics.
Cons:
- Complexity of configuration for beginners.
- There may be scaling issues under high loads.
2. Prometheus
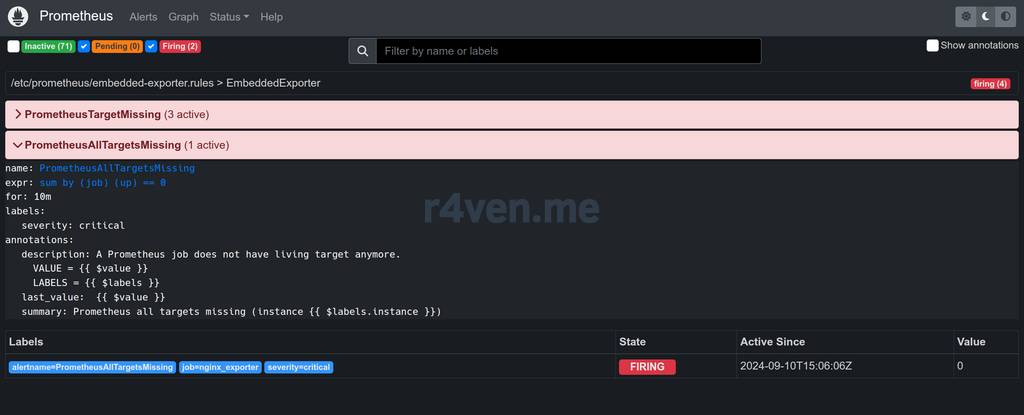
Prometheus is a powerful open source monitoring and alerting system, widely used in the DevOps environment. It’s focused on metrics collection and supports a special query language, PromQL.
Pros:
- High data processing speed.
- Perfectly suited for dynamic cloud environments.
- Easy integration with containerization systems such as Kubernetes.
Cons:
- Limited capabilities for working with logs.
- Difficulties with long-term data storage.
3. Grafana
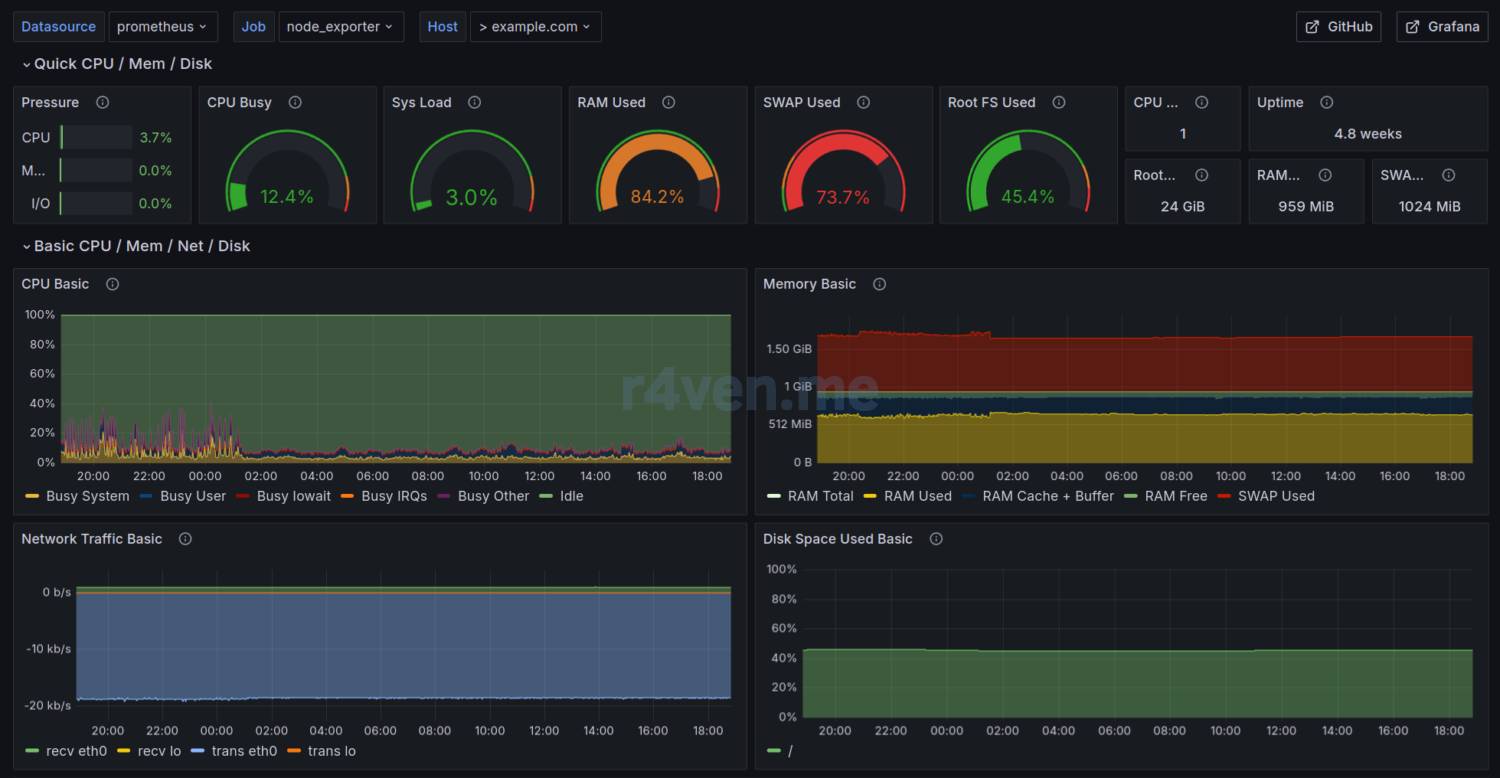
Grafana is an open source tool for visualizing data from various monitoring sources. It’s often used together with Prometheus to create visual dashboards. It also has notification-sending functionality out of the box.
Pros:
- Support for multiple data sources (Prometheus, InfluxDB, ElasticSearch, Zabbix, etc.).
- Flexible and detailed dashboards.
Cons:
- Doesn’t collect data on its own (requires a source).
- Requires skills to configure graphs/dashboards.
4. Nagios
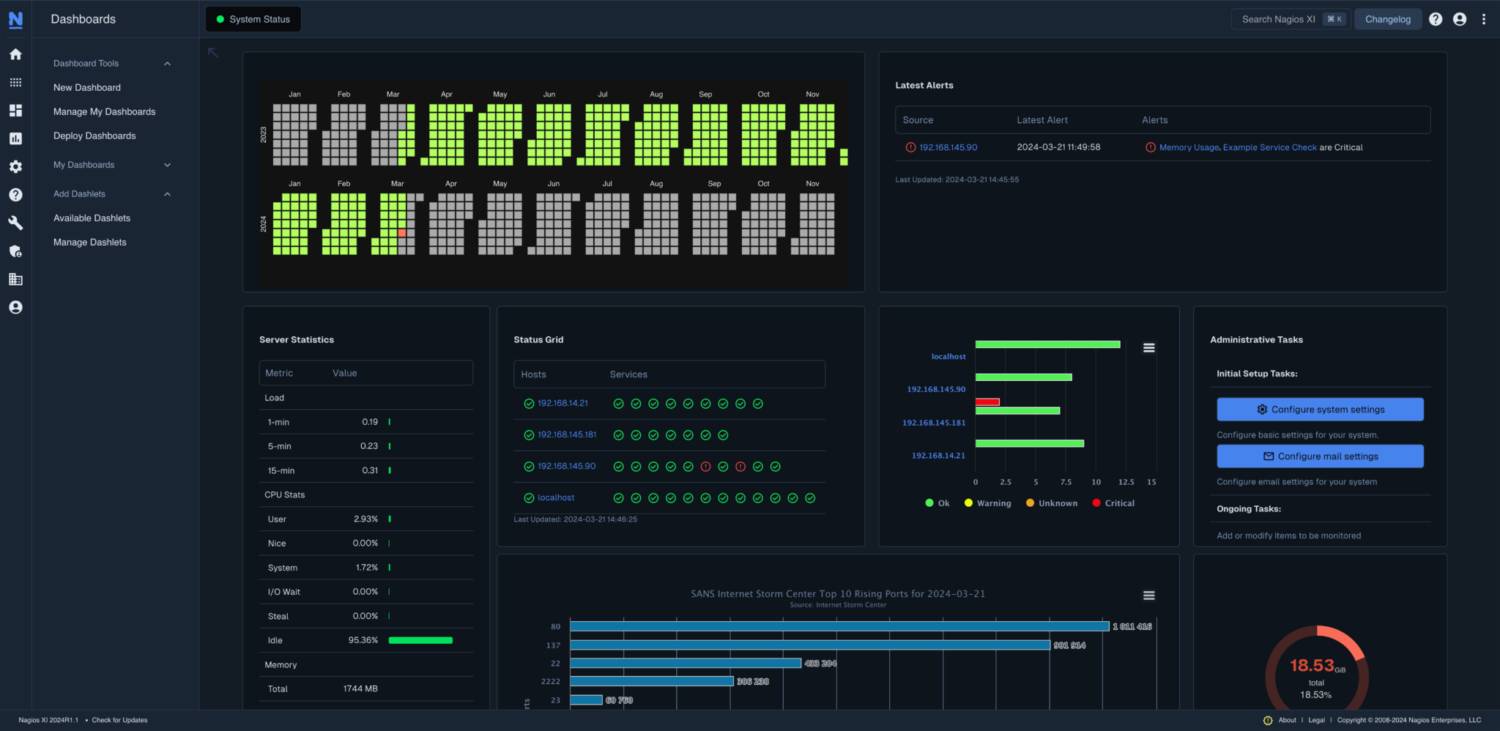
Source: nagios.org
Nagios is one of the oldest and most well-known monitoring systems, focused on monitoring servers, networks, and applications. It’s also open source.
Pros:
- Wide plugin support.
- Suitable for small and medium networks.
Cons:
- Complexity of configuration for beginners.
- Limited scalability.
Conclusion
In today’s world, no serious IT infrastructure can do without a monitoring system. As I mentioned earlier, MS plays an important role in ensuring the stable operation of monitored systems.
The choice of a suitable tool depends on various factors: company size, application type, and other infrastructure specifics.
The purpose of this note is to give the reader a general understanding of MS and their purpose. In the near future, an article will appear on the Raven blog about deploying one of the popular open source MS — Zabbix, originally written by Alexei Vladyshev — in Docker.
Useful sources
👨💻And…
Don’t forget about our Telegram channel 📱 and chat
Or maybe you want to become a co-author? Then click here🔗
💬 All the best ✌️
That should be it. If not, check the logs 🙂

Comments